In this article we are going to make a Docker Image containing grafana, influxdb. The target is, we have seen making live dashboard in Ubuntu & windows in VM, and we will make docker images to do the same. (no need VMs). For this we need to have docker in our PC. See how to install docker in Ubuntu.For other platform, you may follow this.
The plan is to have two different containers running influxdb and grafana and when we run JMeter, this actually store results in influxdb and grafana dashboard is showing.To know more about grafana dashboard configuration or influxdb configuration, i request you to read this
Run container for influxdb:
I am not using default influxdb container as we will use our own configuration files to run with.
- Step 1 : Make a folder name influxdb
- Step 2 : Create a file name Dockerfile & copy past all from this source. This is a basic script to build an image for influxdb.
What I did here ?
- Using ubuntu 14.04 images
- Install VIM, wget, curl , in case you need those software . I prefer those for editing or downloading for long term image using. Only wget is mandatory to download
- Install Key and certificates (basic for influxdb)
- Download, install & remove influxdb installer.
- Expose our necessary port(read this to know about default port) which will work with localhost.
- Setting some environment variable
- Putting CMD command so that when container will run, this command can run influxdb with our given configuration.
-
Step 3 : create a configuration file(influxdb.conf) or you may copy from here or from repository.
-
Step 4 (optional): Make a build.sh(bat file in windows) file and add build command line
docker build --tag 'influx/influxd:jmeter' --no-cache=true .
if you don’t add this file, you have use this command for building.
-
Step 5 : (optional) Make a run-influx-docker.sh(bat file in windows) file and add build command line
docker run -i -p 8083:8083 -p 8086:8086 -p 2003:2003 influx/influxd:jmeter
if you dont add this file, you have use this command for building.
- Step 6 : From command line a. Run build.sh and b. Run run-influx-docker.sh
(if you dont make those bat file, run commands in cli)
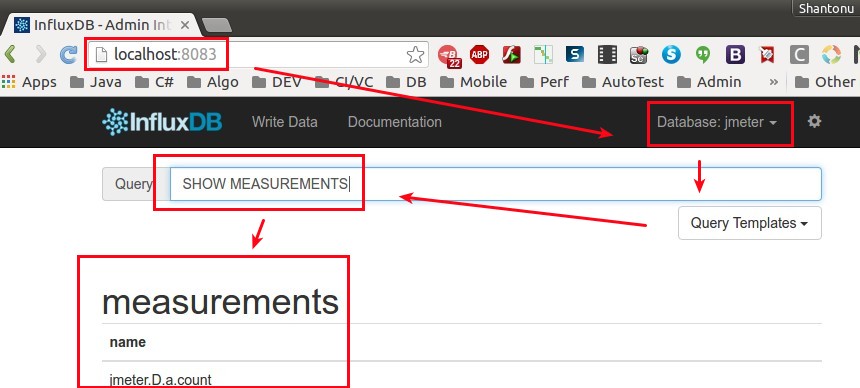
Now, check influxdb like following my this post.
Run container for grafana:
I am using default grafana docker image(grafana/grafana:latest) . I pretty much follow the items form here, just in some optimized manner(following mandatory steps). This is just default steps for grafana container , no spatial configuration. So, like as influx db
- Step 1 : Create a folder , named grafana
- Step 2 : Create a file, named Dockerfile and copy these text inside
What am I doing here?
- installing vim, wget, curl
- installing grafana
- Exposing in port localhost:3000
- Assigning volume
- Having entry point gr.sh
-
Step 3 : Make a file gr.sh (entry point file, mentioned in Dockerfile) and put this inside. you can see, it only executes grafana server with defined path.
-
Step 4 : Make a file GRAFANA_VERSION with no extension(used as argument in Dockerfile) , edit with latest version of grafana, like this.
-
Step 5 : Make a file build.sh which actually contains build instructions (like as influxdb) following this . You can see, it is checking version and if not found, will download from docker remote registry.
-
Step 6 : Make a file run-grafana-docker.sh to run this container with this commands.
-
Step 7 : From command line, run run-grafana-docker.sh
For the first time it will download and install and after that everything is okay.Now, check grafana like following my this post. You need to login, add database and organize dashboard for JMeter monitoring.
JMeter-Grafana docker Live monitoring :
- This was my backend listener from previous post
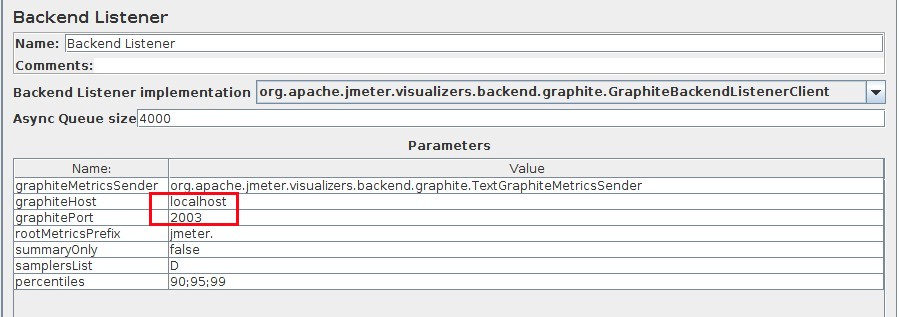
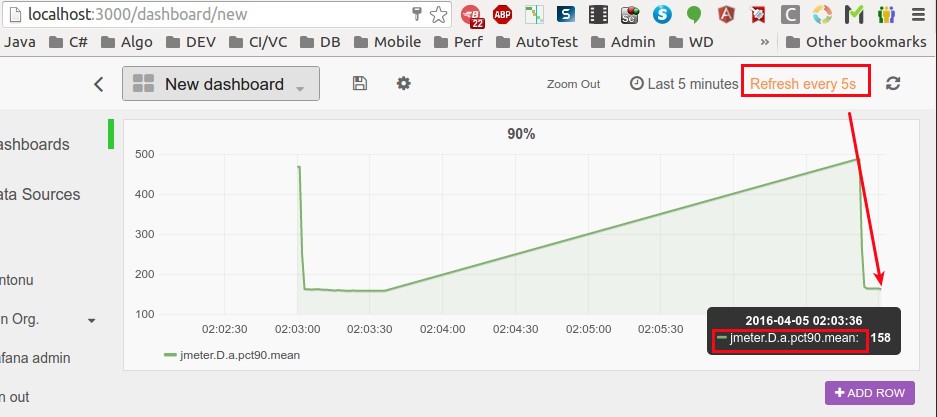
And, if you run JMeter, you can see dashboard. Again for dashboard configuration, use steps from my previous post
And grafana :
Helping Tools :
-
ATOM text editor with docker file support Or (better solution) Sublime text with docker plug-ins. Now a days, intellij idea with docker plugins.
In whole example, I am using this following properties/parameters
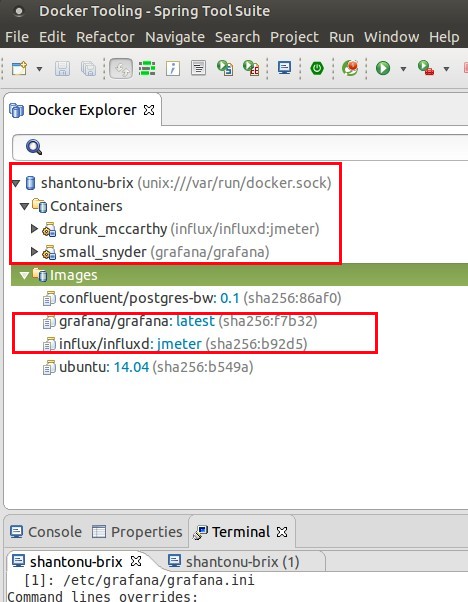
- Name of influxdb Image -> influx/influxd:jmeter
- Name of grafan image -> grafana/grafana:latest
- Grafana Expose URL : localhost:300
- influxdb expose URL , all in localhost with ports 8083, 8086, 8088, 8091, 2003
- No password for influxdb
- Grafana password , default admin admin.
Source
I put an extra influxdb configuration “configure.sh”, in case you need manually configure for db initiation.
Note : All examples are inspired by
- https://github.com/influxdata/influxdb-docker
- https://github.com/grafana/grafana-docker
Thanks.. :)