In this article we are going to see how can we build a live performance test monitoring solution for JMeter test results.
Main Idea :
JMeter GUI is well known for its huge resource intensiveness. So monitoring results with GUI become very very non realistic on massive load. In here we will use JMeter in CLI mode to test and monitor results via Gratiana. This article is intended for installation & basic configuration only. Detail Grafana graph configuration will be given in separate post.
What is Grafana ?
Grafana is well known industry standard monitoring dashboard used in devops. We will use this for performance monitoring. Project link . It needs a data source. so, we will use influxdb.
What is Influxdb
Influxdb is a database which has inbuilt http based management console and provide flexible data storage . We will use inflexdb graphite plugins to connect this with grafana. Main project.
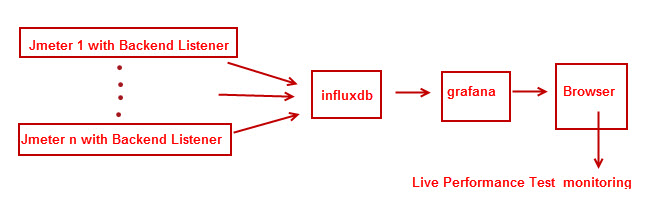
We will use JMeter Backend Listener to generate results and influxdb to store the results. Grafana will take results with simple query and show in browser. In a nutshell , this is the procedure.
Why this is useful?
- Grafana graphs are very good for analysis.(zooming, combined graph)
- As results are stored in DB, we can analysis when ever we can
- We can monitor results live
- We can monitor results from multiple JMeter nodes , so no need JMeter client-server execution.
Setup VM
In this whole example, I am using ubuntu 14 VM, you can use real PC or even docker. These are some of properties of my VM
    IP (host name) : 172.16.244.137
    username : shantonu
So, when you try this instruction, you should use your VM’s IP.I will use same VM to host influxdb & grafana. You can use different host.
Installing InfluxDB :
-
Step 1 : Download & install influxdb in command-line
  $ wget https://s3.amazonaws.com/influxdb/influxdb_0.10.1-1_amd64.deb
  $ sudo dpkg -i influxdb_0.10.1-1_amd64.deb
main url : https://s3.amazonaws.com/influxdb, where you can see different packages including windows
Note : you may start influxdb as service but before starting as service you need to configure graphite plugin format which allows us to communicate with grafana.
-
Step 2 : influxdb Configure : After installation, influxdb configured in following ports. Http (TCP) Management Port : 8083 ,DB TCP port : 8086
-
Step 3: configure graphite :
Way 1 :
- We wont start influxdb as service initially,
-
Get default configuration : In command line ,
$influxd config you will see the configuration. Copy this and save to a file (I am saving to **influxdb.conf**) -
Append graphite plugin configuration : I am adding this following at the end of influxdb.conf file.
[[graphite]] enabled = true bind-address = ":2003" database = "jmeter" -
Start influxdb with our configuration : in command line
$ influxd -config <path>/influxdb.conf [in my case influxd -config /usr/local/etc/influxdb.conf] - Now, to make life easier, I want to start influxdb with my configuration when my VM starts. So, I make a shell file(sh) and make it executable and keep it as startup. My influxdb.conf file link , (contains my user name, so change before use)
Way 2 : It is a small trick, just start influxdb service with your own configuration.
    $ cd /opt/influxdb
    $ ./influxd -config <path>/influxdb.conf in here , like way 1, we are using same file with just added graphite configuration.
Validate Installation & Create DB for JMeter :
- Now we have configured. Let’s open browser and hit localhost:8083 or http://172.16.244.137:8083/
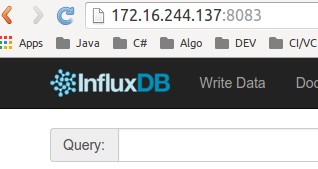
- We can see management page. From query templatex , you can see lots of important info.
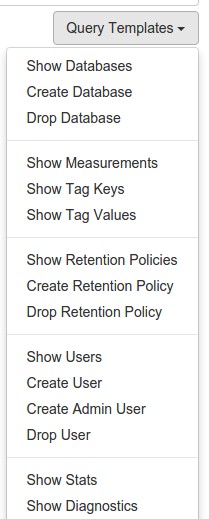
- Lets create a database for JMeter (named as JMeter) :
CREATE DATABASE "jmeter"
- (Optional) , lets create an admin user. (i have created) :
CREATE USER "shantonu" WITH PASSWORD '******' WITH ALL PRIVILEGES
Important Note : If your adding repository is miss configured , you might face error while apt-get update. To solve this, you need to edit influxdb.list file under /etc/apt/sources.list.d folder. Just open this file as root user and edit the file
deb https://repos.influxdata.com/ubuntu precise stable
Installing & Configuration of Grafana :
-
Download & install grafana from here As, I am using Ubuntu , I am downloading & installing via command line : (you need your admin credentials)
  $ wget https://grafanarel.s3.amazonaws.com/builds/grafana_2.6.0_amd64.deb
  $ sudo apt-get install -y adduser libfontconfig
  $ sudo dpkg -i grafana_2.6.0_amd64.deb
  $ curl https://packagecloud.io/gpg.key | sudo apt-key add -
or if you are getting from APT. Add Package Repository URL( in /etc/apt/sources.list)
deb https://packagecloud.io/grafana/stable/debian/ wheezy main
And install in command line :
    $ sudo apt-get update
    $ sudo apt-get install -y grafana
-
Start Grafana : I prefer to start as service so that each time I turn on my VM , it actually turned on automatically.
$ sudo service grafana-server start -
Grafana web admin: Now, if I goto my real PC browser and hit http://172.16.244.137:3000 (or in VM localhost:3000) , I will see grafana home page. Use default (admin, admin) as user name & password to get the dashboard.
-
Adding data source : Click Data Sources > Add New
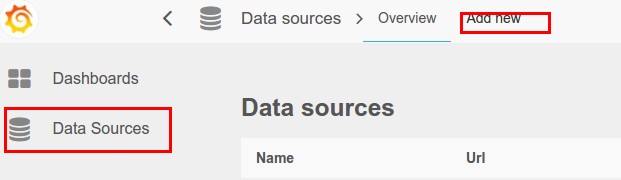
-Select InfluxDB from type , give any name .Put your DB URL and port which is open for getting data(DB port)
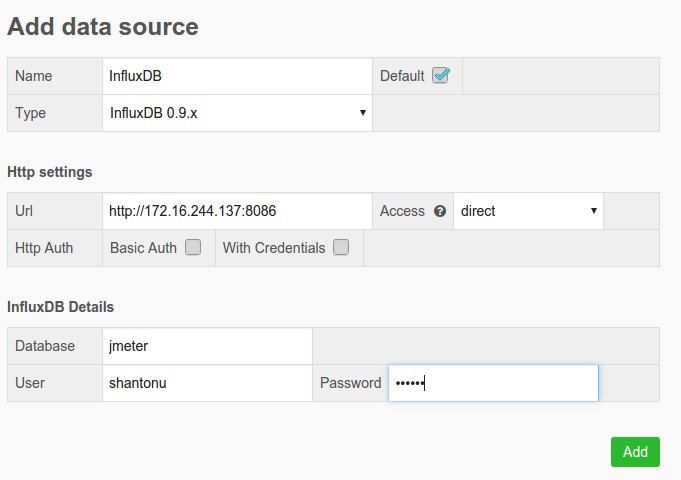
Optional : I used but no need: Credential Information & Name(u can use any name)
Making Dashboard :
I will be brief in this section due to different scope need different graph. I will make a separate post on JMeter Plugins equivalence graph configuration in grafana. You can use grafana graph generator (https://github.com/bhattchaitanya/Grafana-Dashboard-Generator) to auto graph generation before tests. So, after configuring DB.
- Click Home & add a Dashboard (click New)
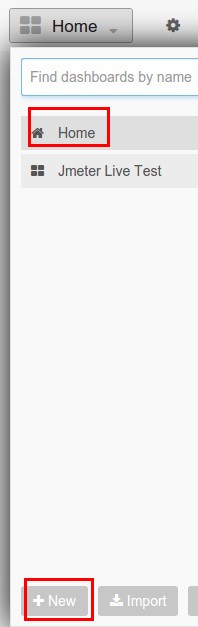
- You can see, I have added JMeter Live Test Dashboard. In blank dashboard add a graph
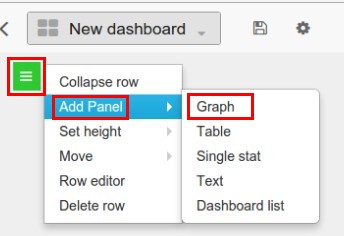
- I will include simple query . When you see blank graph, you will see something like this ,
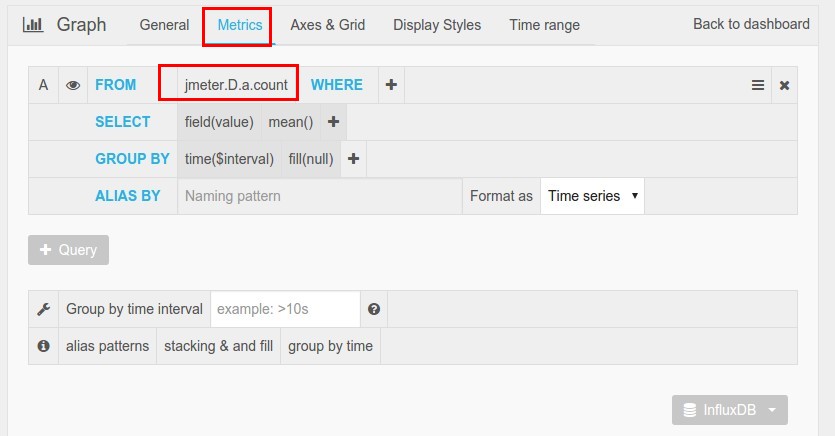
- Add jmeter.D.a.count. What does it means?, simple, it shows count of D request from JMeter table( a refers to single object/table).
- I “General” tab , you can can configure( I use title as Max)
- click save & back to dashboard. You can use multiple query results in single graph.
Example:
In this example I have added,
- single measure graph(MAX count of D),
- multiple measure graph(95th % + Max response time) &
- three overall info(started , max, ended thread count) . So finally my dashboard looks like this
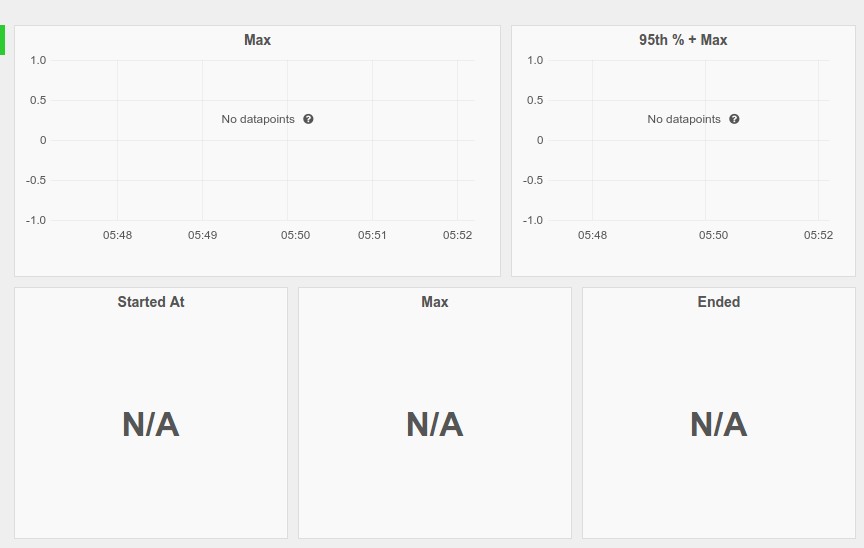
- Each graph is editable & re-sizable, if you click a graph, you will see this menu
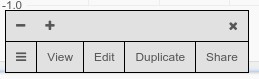
In here you can configuration or size.
JMeter test to monitor live results:
- I have created a JMeter test case with single request(http, get to google.com, renamed label as D)
- I have added Backend Listener, I have configured
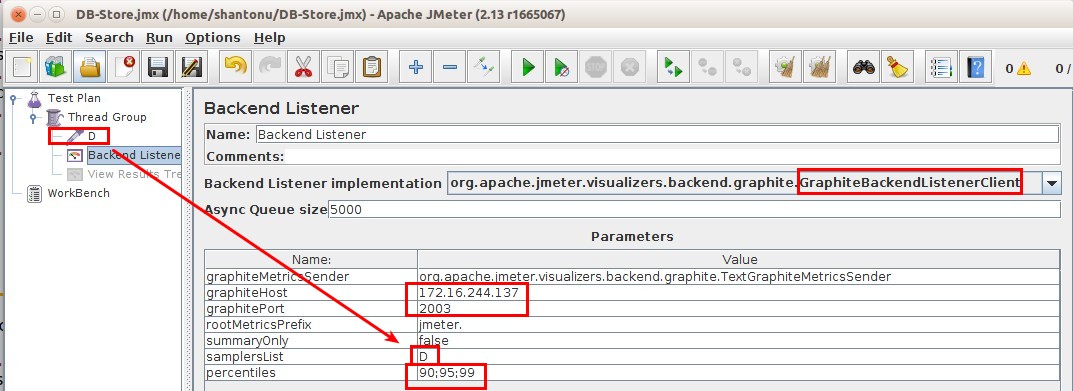
- graphiteMetricsSender : org.apache.jmeter.visualizers.backend.graphite.TextGraphiteMetricsSender
- My Host(VM) -> graphiteHost : 172.16.244.137
- My Host(VM) -> graphitePort : 2003
- Name Prefix of DB entry -> rootMetricsPrefix : JMeter.
- To have detail results -> summaryOnly : false
- The Name of sample from test cases -> samplersList : D
- Selected Percentiles -> percentiles : 90;95;99
Note : Multiple entry rules , add semi colon (;) as separator
Now save the test plan and run it with forever loop(1 thread, 1 sec) , so that we can see update in DB as well as grafana. So, press start. (you can run test command line also)
Checking update in InfluxDB :
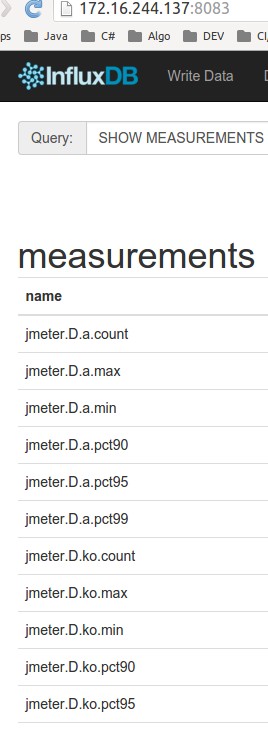
- Goto http://172.16.244.137:8083/
- From top right corner, select database JMeter
- From Query template , select SHOW MEASUREMENTS. This will show jemter tests are saved in DB
Checking Update in Grafana :
As we have configured graph,
- if we go to url http://172.16.244.137:3000/
- Select our dashboard (Home > JMeter Live Test) we should be able to see this
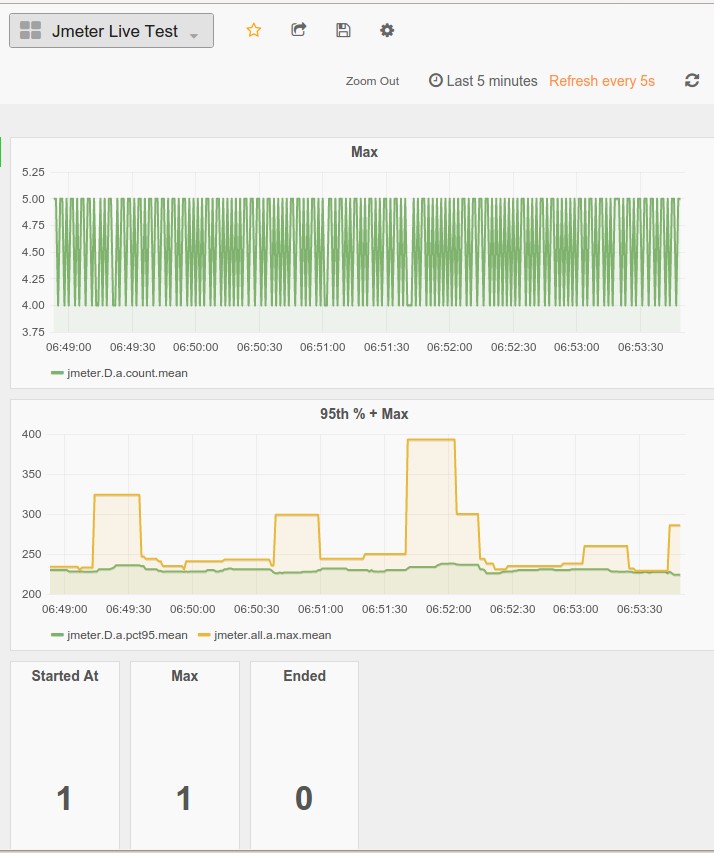
As test is running, so END is 0.
So, we have successfully setup grafana-influxdb JMeter graph to see live results.
Useful Links :
- InfluxDB Basic
- Auto Grafana Graph generator for JMeter Test Case
- Integrating JMX monitoring with Grafana
- Docker-grafana-influxdb
- nice blog
- learning influxdb
Initially I read this in here with may many people’s confusion. This post was intended to clear some of confusion. I hope this will help.
Thanks.. :)