This is continuing post of Live Performance Dashboard only this time with windows(as I have promised). I would suggest, please visit that post to continue.
In this example, I am going to setup influxdb & Grafana in windows 8x64 PC in VM. You can use real PC/AWS. And like as before, I will run JMeter in my local PC to test keeping monitoring system isolated. My Local Address (in this whole example) : 172.16.244.135
Note : As influxdb/grafana will be accessed from outer network, make sure you put in outbound firewall rules so that others can access this
Step 1: Installing InfluxDB :
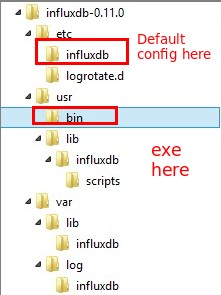
- Download Influxdb from here. It is standalone zip. If you extract, you will see something like this.(i renamed in to influxdb-0.11.0)
-
Now, open command prompt and get default configuration (in bin directory all exe are present)
influxd.exe config
So, you will get default configuration.
-
Copy this to a notepad and save as influxdb.conf. [to make life easy, i save my own influxdb.conf in bin , so default one in etc, my one in bin]
-
Now, if you run this you will see error messages due to local host address resolver is not working for windows. Github discussion.. Easy to solve , add local host with port number. I change the under
[meta] bind-address = "localhost:8088" http-bind-address = "localhost:8091" -
Now, add graphite configuration at our influxdb.conf.
[[graphite]] enabled = true bind-address = ":2003" database = "jmeter" -
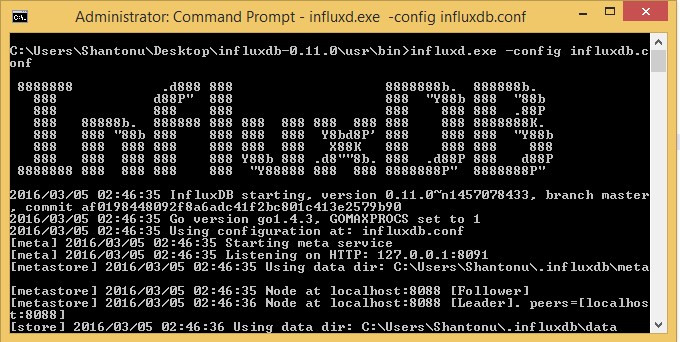
So, open command line , goto bin directory (where influxd.exe & influxdb.conf are present )
influxd.exe -config influxdb.conf
- Now, if we goto browser and see http://172.16.244.135:8083 , we will be able to see home page.
- Like as before , create a table ‘JMeter’.
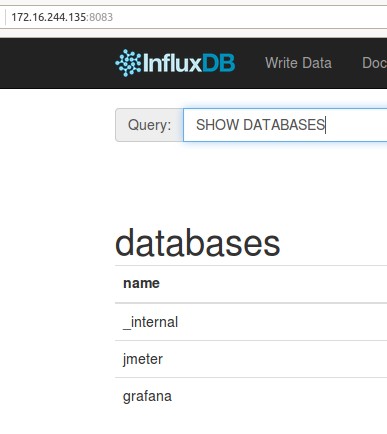
And , if we see show database ,we should be able to see DBs. So, our influxDB setup is done.
Step 2 : Installing Grafana :
- Download grafana standard from here . I am using 2.6.
-
Extract it in your suitable location. (i also renamed in grafana-2.6.0 to keep things simple)
-
Now , Open command line, goto bin directory under grafana-2.6.0 and execute grafana-server.exe. You will see server running.
- Goto browser http://172.16.244.135:3000/. And you should able to see grafana home page for login prompt. use admin, admin to login
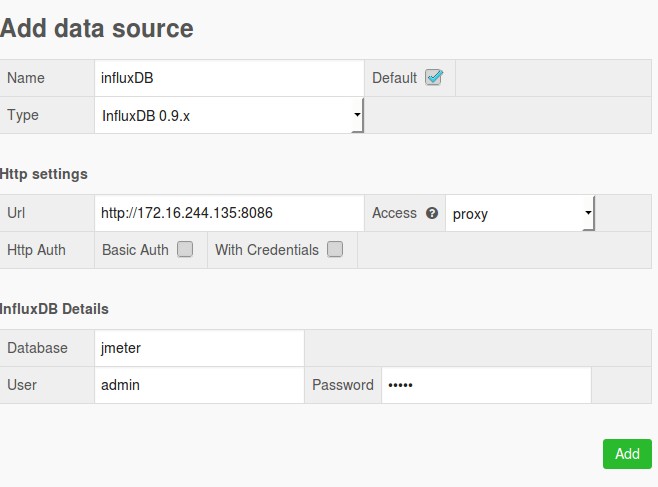
Like as previous post, configure influxDB settings into grafana.
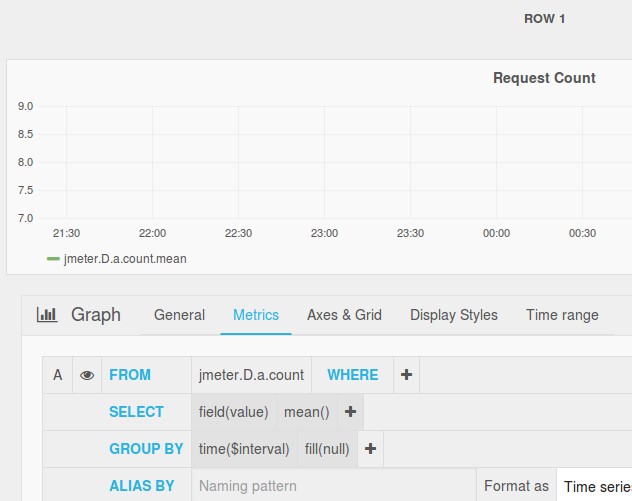
Like as previous post, make a dashboard. (I am using same request count)
So, we are done setup, now lets test it.
JMeter Tests :
Like as previous post , I am using same test case just changed the URL to 172.16.244.135
Now, if we run JMeter
- goto http://172.16.244.135:8083
- select JMeter from right upper corner.
- from query template SHOW MEASUREMENTS
we will see like this.
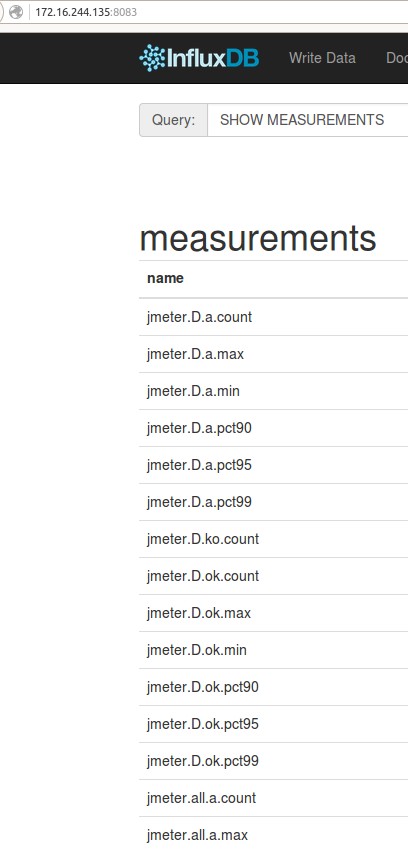
This means DB is getting Data.
- Now if we goto grafana dashboard (our dashboard name JMeter Live ), we should be see graph for request sending
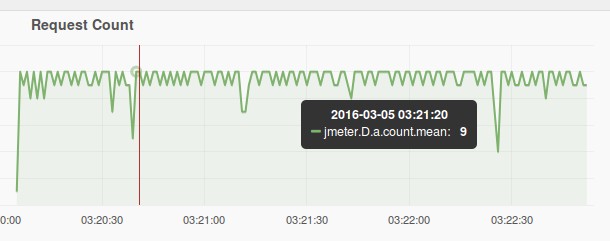
So, Like as Ubuntu , we have completed our setup a live JMeter result monitoring system with Grafana & InfluxDB.
Note : As I am installing in my PC, ignore my user name, for your PC , it will be your’s. So, don’t just copy past my configurations.
Thanks.. :)