In this article we are going to see generic ideas about memory leak detection technique. We will use Top Down approach so that we can actually see symptoms from outside of application to inside.
For this example, I will add reference on a java(j2ee) and a dotnet(Asp.Net/Web Forms) application. I will try to avoid theoretical definitions , rather using my own way to express.
What is a memory leak?
By the name we can understand, it is about high memory consumption. Actually, it has large impact in several type.
In generic way, when an application’s required memory increases while application is running, it might refers to memory leak.
Not necessary a memory increment will be a definite leak, but, logical relation between functionality and required memory can define if it is leak or not.
Based on symptoms, I define memory leak in two categories.
Symptom : Increase of memory usages:
While running application , if we see the system memory & application memory usages(heap+non heap) increases, that is clear indication the required memory is higher. We need to relate this with action that we perform with the application.
Let’s say , if our actions on application working with large volume of data, it is logical to have memory increment.
But, we need to get, how much. And, we need to observe the new object that are created for those actions are removed from run time environment as soon as the functionality ended.
(for Java/Dotnet a , force GC from profiler should be useful to judge if the objects are collected as soon as they are useless)
Some times, we can see the memory increases more and more like stepping up thread, even after GC memory consumption is still growing and we can see generational changes.
For DotNet :
- Gen 0 will be Gen 1
- gen 1 will move to get 2
For java :
- Nursery -> survivor( S 0),
- S0 -> S 1
- S1 -> Tenured (old gen).
This can lead to critical stage and cause Out of memory Exception.
Symptom : Memory usages is not dropping:
While running application with large number of user or data (typical stress test scenario), if we see memory is not released and for longer time observation, the memory is still occupied. This may cause memory increment for new action perform on application.
To ensure this symptom, we may perform force GC to see, if memory usages are going down then it is okay, if not, that means, it is constantly occupied. And, we can see the same generational changes of memory like as described in previous symptom .
It is very logical, when we perform some task on application, it will load new class , create object and do the task. But as soon as we complete, we should expect those objects should be destroyed/cleaned in next GC cycle.
Tools :
- OS Memory monitoring tool : perfmon or similar
Application Memory monitoring tool
- Dotnet : VMMap, any profiler like ANTS memory/DotMemory,
- Java : JConsole/Visual VM, Java Mission Control(JMC)
- IBM JAVA : Health center Under IBM Support Analyst
- Or, Commercial Profiler like Yourkit or JProfiler
- APM : you may also select any APM tools(Dynatrace, NewRelic or AppDynamics) for both technology monitoring.
Snapshot collection & compare Tools :
- Dotnet : Perfview, Ants memory, DotMemory
- Java : JConsole/Visual VM, JMC,Yourkit, JProfiler
Analysis tool :
Either manually, see things as you need or follow up commercial tool suggestions.
how to find the memory leaks ?
I will follow Top down analysis. I will provide separate blog post for what is top down analysis, for quick recap, top down analysis refers to approach on performance analysis from top level system to deep drive into code at run time .
Step A : Choose Scenario:
First you need to know which area of you application might have memory leak. Usually, leak analysis activity comes after any performance test or profiling activity or in worst case Out of Memory exceptions happened.
In all cases, the initial steps must be know which actions or events or UI interactions are causing this suspects. This will ensure, the effort you are doing , is going on right direction.
For example : Let’s consider a banking application, when user signs in , he gets account balance & all other baking functions. If he do credit, debit or any transaction, due to different 3rd party dependency , the application takes large memory and leaks are suspected.
Step B : Monitoring :
Monitor Environment/OS Memory Usages :
After knowing application , either by automation (load test tool or function test tool) or manually, you should run the same process repetitively for a longer period and monitor memory usages of
- Host PC using OS monitoring tool
- Application Process (each OS has process monitoring)
- Application Run time (Java/Dotnet)
This part is based on architecture of run time, to know more detail you can visit my posts below. This is small example for a IIS process monitoring with task manager and profmon.
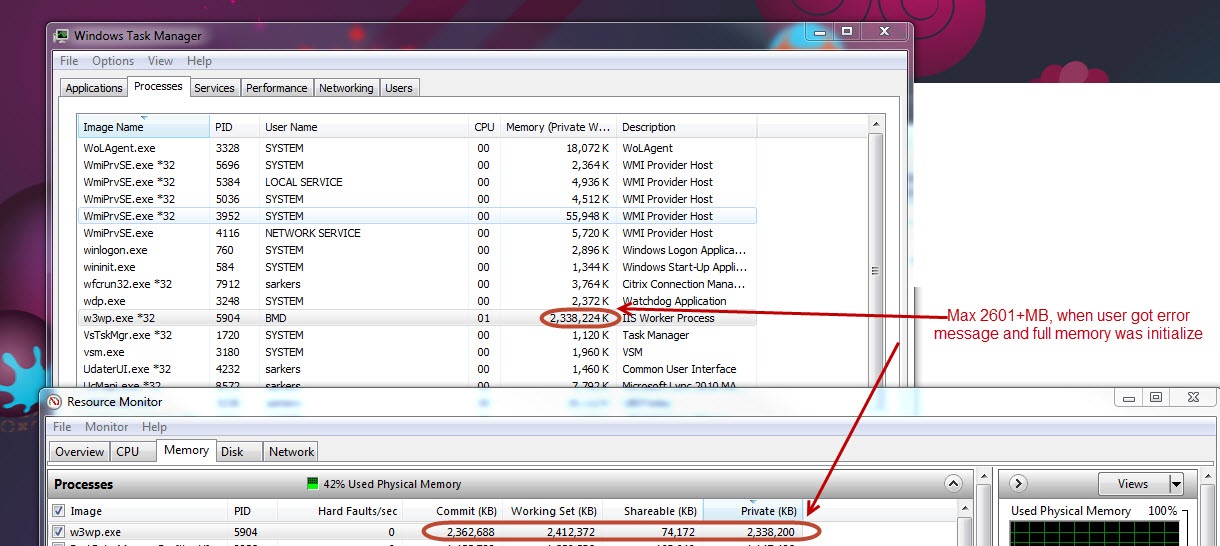
Now, we have clear visibility over environment for memory and we can see the memory usages trends (over time). Let’s go to next stage.
You can do application internal monitoring also with any profiler.
Step C : Breakdown your Scenario:
After getting memory usage over time, break down with your chosen areas(from step A) separately and narrow your scope. You will have small , well defined small steps from all steps.
Form Step A example, in here we will choose, any of steps for memory leak. Let say debit transaction. And, lets assume, for debit transaction , we need to
- log in & see home screen
- Go to , transaction
- Select , transfer money to another account
- Give all inputs and click transfer
- Wait for mobile/id verification steps & complete that
- See the successful message .
Step D : Prepare Memory profiler :
We have fixed , small group of steps as a part of big scenario. Now, prepare your Memory profiler. I recommend : following for this
DotNet
- Perfview (free)
- Dot Memory (I prefer)
- ANTS Memory Profiler
Java
- Visual VM (free)
- Jconsole(free)
- JMC(free)
- For IBM JVM, Health center(free), if JMC/VisualVM/Jconsole are not supported
- JProfiler(I prefer)
- YourKit
Note : It is easier to use paid tools compare open source tools to find memory leaks due to their data visualization & support.
-
So, attach your memory profiler and take a memory snapshot at the beginning of the steps that we have chosen in Step D. From example, Just after log in.
-
Perform each step in UI and take related heap snapshot in memory profiler.
Note : if you are testing JS/Ajax application, make sure your UI requests passing to server from browser tools, without this , you may see no changes in server due your actions in UI
So, after doing all steps, you will get a heap snapshot for each step.
Step E : Comparing snapshots :
Consider initial heap snapshot as Baseline or zero snapshot. Let say, we have take total 5 snapshots and No 1 is consider as base snapshot.
So, now, we can compare in two ways.
- Comparing each snapshot with baseline : It will show the differences from initial state.That means, from example, comparing Snapshot 2, 3, 4, 5 with snapshot 1.
- Comparing each snapshot with it’s previous snapshot : This will show gradually growing. That means, from example, comparing Snapshot 5 with 4, 4 with 3, 3 with 2, 2 with 1.
Step F : Snapshot Analyze
If you do comparison, paid tool will give you differences by default. For Free tools, you might need get those manually by shorting, binding, folding. So, lets see what items that we need to see.
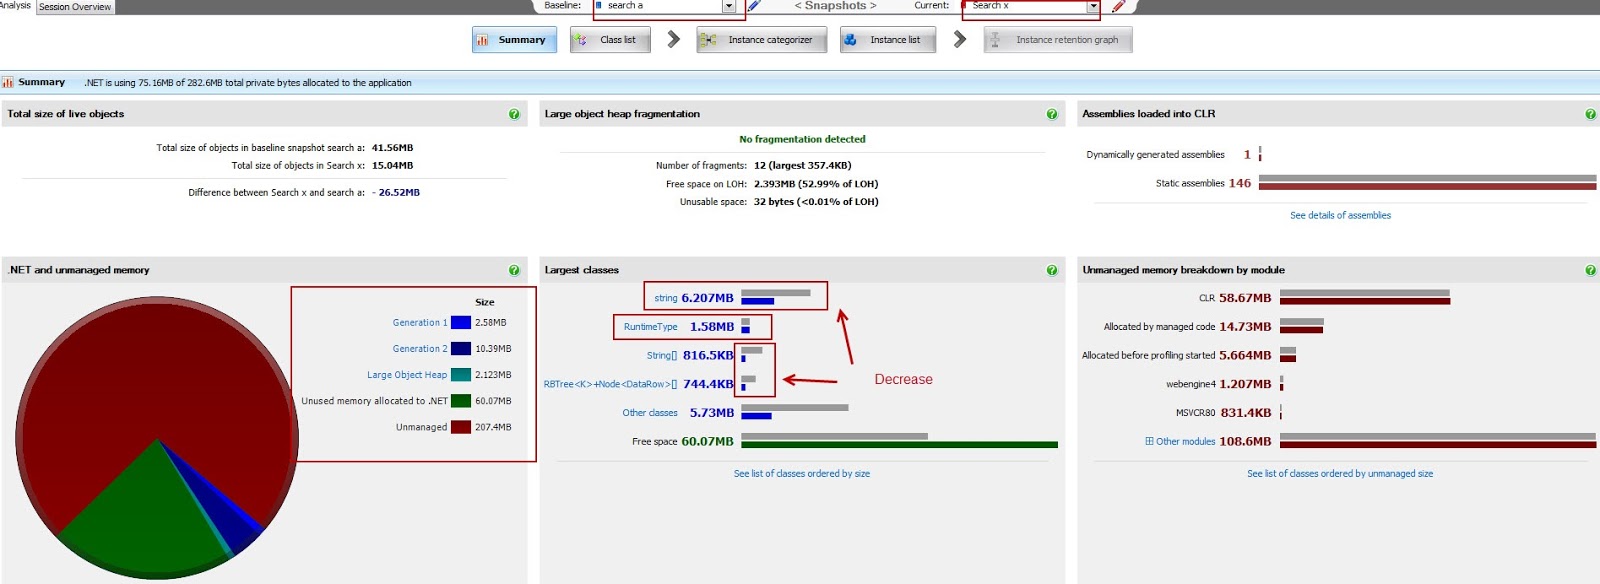
Summary Analysis:
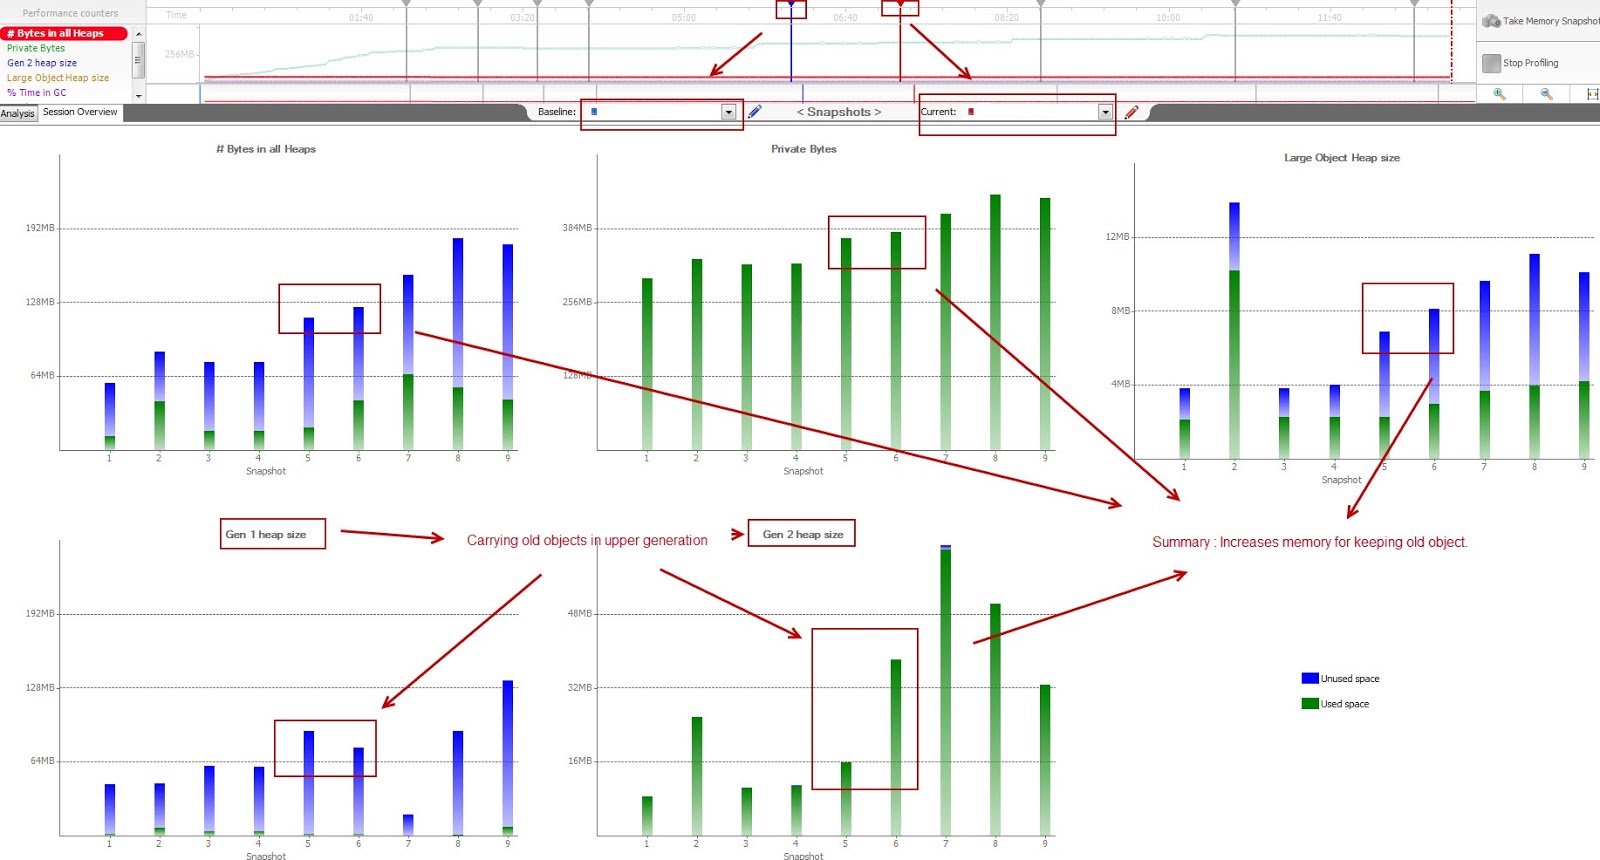
A summary view of memory growth among all snapshots. In the summary , we need to see
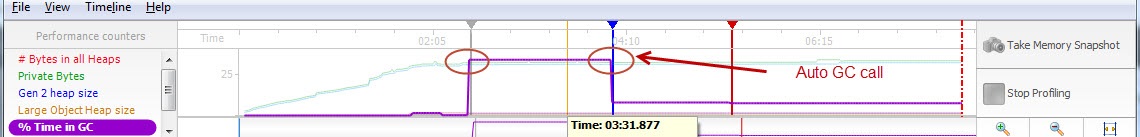
- How many time GC happened (to estimate our expectation)
- Heap memory growth , break down into Generational heap(dotnet) or Nursery/Survive/Old generation(Java)
- Base on Old generation growth & GC events decide was it necessary. In fact, if your application has manually GC calling, you might see extra old generation(gen 2 in dotnet) increases.
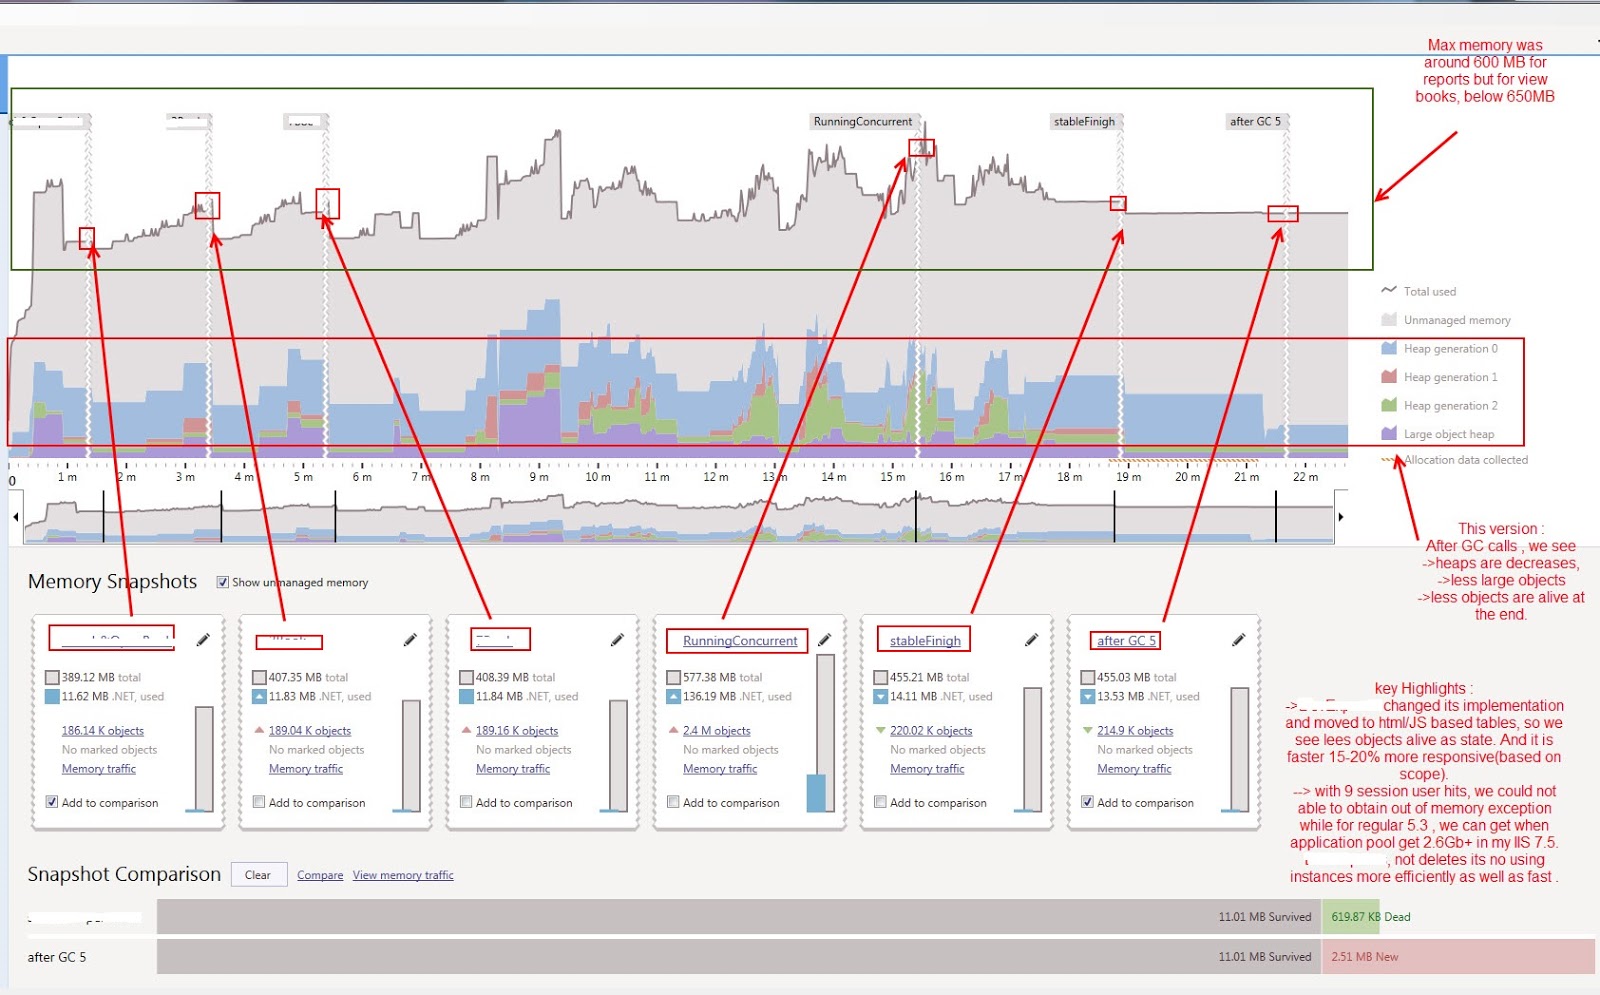
I am giving Small Example from ANTS memory profiler or Dot memory.
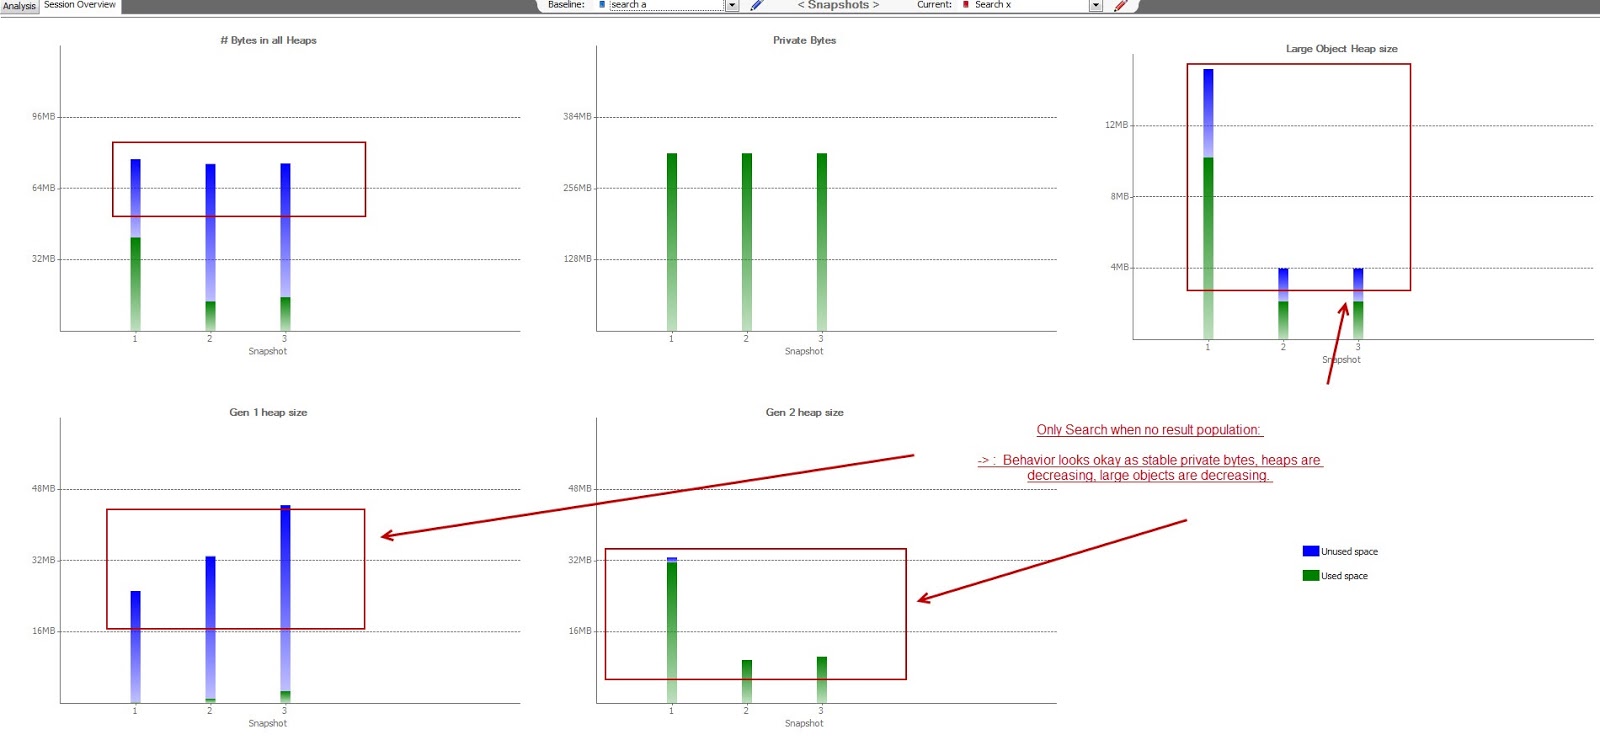
This happened when we solved a small part of the problem(only search).
In DotMemory
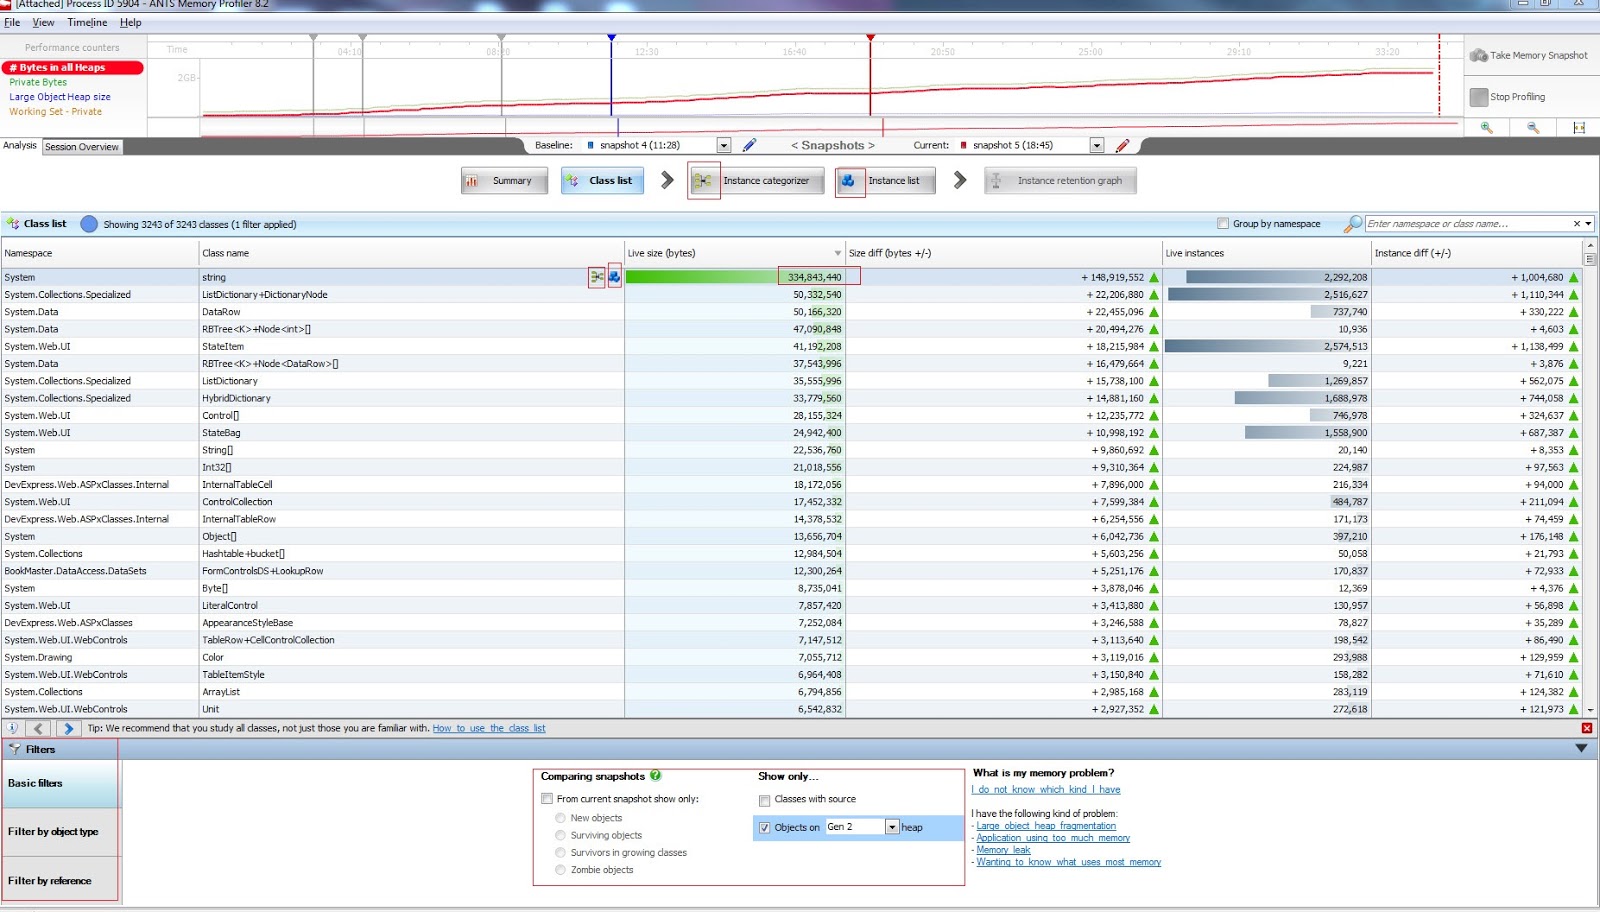
Comparing Heap snapshots :
In here , we need to see following differences
- New Objects : to determine what new objects are created for our particular step
- Survival Objects : Which object are necessary from previous stage. (like session object, previous data)
- New Classes : Newly present class in run time, relate to the step . We might look at to Class loaders also
- Big Objects(85k+ for dotnet only) : In CLR these are separately handled can do filtering based on object size
- Promoted Generations : Promoted objects indicates long living live objects.
Reference Analysis :
After looking from heap snot comparison, we need to go further with specific target.
- Get which snapshots differences are large in both size & instance count.
Note : in Java, the size has two type, shallow size, refers to size of the object only & retention size, refers to the object size + all outgoing reference size(actually the memory that can be free due to its clean up)
For each candidate, try to analyze:
- If there is any circular references. Please exclude same interface implementation.
- How far away an object is from GC happening. This means after how many GC event, this object will be collected. if it is 1, it is nearest. And it will be collected on next GC, so you can easily ignore.
- Size of Single instance of the object. More often, God classes causing serious problems.
- Outgoing references and their size.
- Incoming references and who initiate them
- Instance List, to know exactly how may number of instances, who created them
- Instances which are associated with external resources(DB/File writer etc)
And, in all paid tools, you will get benefit of Retention Graph or Call tree. In this way, you can backtrack from object to its initiator & event. This is one of the main reason why paid tools are easy to find memory problems quickly.
And in summary, know your application memory usages: This is very key point, of going forward.
So, now you get your leaking object, you get who is calling, how it is called. And, you have to eliminate leaking. For that , there are some generic and technology specific workflows.
Note : Most of tools trigger a Full GC before taking snapshot, so for analysis you need consider that event with mealtime data monitoring and heap comparison analysis. For this, you may use free tools(shipped with framework) to take manual heap snapshot and compare them.
These are good reads for this article :
- A quick overview on JVM Architecture
- What are the elements inside DotNet?
- What is CLR? How it works?
Thanks.. :)