In this article we are going to see a quick overview on JVM Architecture. This is very useful if you are a developer or a performance engineer who needs to monitor JVM and investigate issues .
Our main goal is to know inner components, workflow and key monitoring items. We will discuses only about JVM comes with JDK8.
What is JVM?
JVM refers to java virtual machine. It comes with JDK/JRE. JVM is the runnable instance where JRE is the main packages of JVM , Java Package Classes and necessary run time items containing with this. So, JVM is a part of JRE.
When an application launches, it creates it’s own JVM to run.
JVM Components :
JVM has mainly 3 component.
- Class loaders
- Run time Data area(memory)
- Execution Engine.
There is another component stays beside these component which is very necessary, which is Native method interface , Which actually talks directly to OS. In windows , if you open Jre directory , In bin, you can see OS dependent dlls and native method libraries.
Note : Because of these(JNI & Libs), Java Can actually load any OS runnable C++ or DotNet(or any other language) assembly
Now, lets see details.
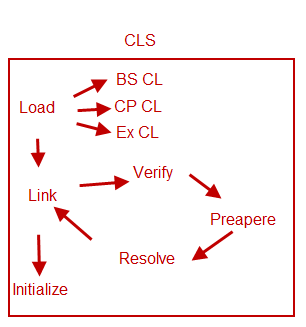
1. Class Loader(CL) :
By the name class loader , we can easily understand what it actually do. It loaded the class(byte code) to execution engine.
To load a class, it must need some checking before initiation and then it will load into memory of execution engine.
A. Loading :
Loads byte code(class/Jar/War/Ear) into memory from local or remote sources.
This has mainly 3 types of class loading by different class loaders.
Bootstrap CL :
Loads the Java’s internal classes. In windows , if you open Jre directory (if you have jdk, inside jdk there is jre) , you can see rt.jar in lib directory which contains packages.
Extension CL :
Loads JRE library Jars from
- Windows C:\Program Files\Java\jre1.8.0_231\lib\ext
- Linux \jre\lib\ext
Application CL :
Loads byte codes (class/Jar/War/Ear) following CLASSPATH or –cp parameters. This is our main application loader. It also follows extension CL to load application dependent libraries.
B. Linking :
Links classes with Execution engine before finalize. The responsibilities can be described in three major parts.
Validation/Validation :
It checks loaded byte code by CL for valid byte code. It check for specification of java class file(byte code). If you
Prepare :
In this step, memory is allocated for class. This is Class property only, that means all static items, meta data of the class. Not instances. And all allocation are done with default values. see Java data type of default values
Resolve:
In this steps, all symbolic references are resolves. That means, all member, all outgoing references(member objects) are actually build in this step.
C. Initialize :
In this phase, classes are actually initialized. It means,
- Static initializer run in here. The block which are declared with static.
- Static values are set. The fields which are declared with static.
Note : Each steps has separate runtime exceptions.
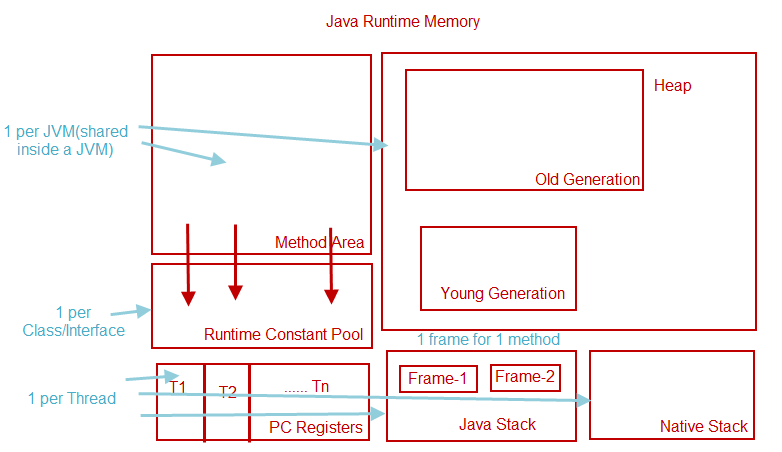
2.Runtime Data area: JVM Memory
In JVM there are 6 types of memory(basic 5) defined by their functions:
A. Method area/Meta Space:
This is JVM’s method spaces that stores Class data/metadata/Class level constant pool/reflections API /static variable are stored here. Class loaders usages this area to load & initialize of classes.
This is actually JVM’s internal memory used to execution. It is created once per JVM.
- Default size : 64MB at MAX.
- tuning JVM parameters are XX:PermSize, -XX:MaxPermSize
Before java 1.8 it was called perm-gen space. Method area is eliminated and replaced with Meta Space in JVM 1.8.
So, -XX:PermSize, -XX:MaxPermSize parameters will show warning messages in JVM 1.8.
Metaspace has no memory limit from JVM, so based on which operating system, meta space can occupy memory. it is dynamically managed by HotSpot.
A high watermark is used for inducing a GC,
- when committed memory of all metaspace reaches this level, a GC is triggered.
- We can use the following flag: -XX:MetaspaceSize=size ,to specify the initial high water level.
Metaspace expand the native memory usages until it gets to some level (starts at MetaspaceSize).
When it reaches the level, it performs a GC (to see if classes can be unloaded).
After that if there is free spaces, it is used , if not it uses more native memory.
After that GC it decides to do on the next level for doing a GC .
- If MetaspaceSize is set higher, then fewer GC will be done early.
Note : MetaSpace size can have performance impact(CPU) due to its sizing and nature of execution
B. Heap Space :
it’s the main area where objects are created. Anytime we create new objects, it is present in here. So, It is has to be tuned.
By default 1/4 th of PC’s physical memory is allocated for JVM.
Example : if I have 8GB ram, Max Heap will be 2GB. Heap is created once per JVM.
We can tune the heap by following JVM parameters
- Xms_Size_, Minimum size of heap
- 8Xmx_Size_, Maximum size of heap
- XX:MinHeapFreeRatio=_Percentage Minimum _, JVM shrink parameter set to minimum to keep low memory usages when it is not needed.
- XX:MaxHeapFreeRatio=Percentage maximum, JVM shrink parameter set to Maximum to keep highest memory usages in full execution.
- XX:NewRatio=Number, The ration of old:young generation objects.ex- 2, means, old:young = 1:2
- XX:NewSize=Size, Young generation minimum size.
- XX:MaxNewSize=Size, Young generation Maximum size.
Heap is divided in several area based on what GC you select. Typically, a heap is divided into two area based on what type of memory they create.
- Young Generation space : For newly created objects.
- Old generation space : For objects that are created in young generation but did not cleaned by GC events due to its usages.
C. Java Stack :
This is similar to C stack, memory space used for method execution.
A stack is created when a thread is created in side JVM . JVM stack stores frames.
A frame is consist for following items.
- Local Variables
- Operand Stacks.
It has more functionality. A frame is created under a method.
-
SStack is highly govern by heap by pushing and popping frames for program execution.
-
-Xss_Size_ sets the java thread stack size.
D. Runtime Constant Pool :
It is representation of a class’s constant pool table. It is created per class/interface. It contains all items from compile time to runtime which actually get resolved.
Each run-time constant pool is allocated from the Java Virtual Machine’s method area (so it is ignored as separate type often). It is constructed for a class or interface when the class or interface is created by the Java Virtual Machine.(Load from Class Loaders).
E. PC Register :
Program Counter Register keeps the next instruction to executed. As you can see, it has instruction data, it is allocated per thread(logical unit that performs tasks). So, if you have more thread in you application, you will have more PC register. Think of this as processor register, works almost the same way.
F. Native Method Stack :
Java memory to execute native method. It is governed by Java Native Interface. This space is used for only native calls, so mostly used by JRE it self, unless we make some native calls from program. It will be used vastly when we write application that calls directly native calls. It has same errors as java stack.
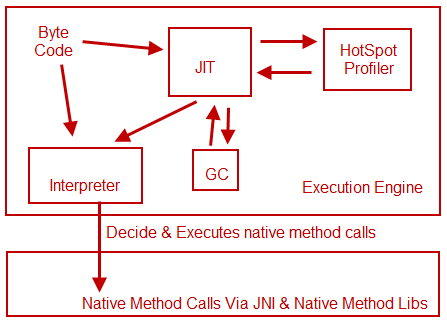
3. Execution Engine :
This part of JVM, performs actual task. Java Execution engine has following parts inside.
A. Interpreter :
It take instructions, decide what to do, defines what native method to call. It takes byte code initially to run native calls which are directly included in byte calls.
B. JIT Compiler :
Just in time compiler. The main functionality is to compile byte code to machine code. Another functionality of JIT is to keep compiled instructions for further usages. That means, if the same byte code block comes for compilation, JIT does not compile that again, it just gives the previously stored compiled code.
C. Hotspot Profiler :
Byte code that are running and compiled are tracked by hotspot profiler. It eliminates same block compilation twice. It tracks those previously compiled machine code and instructs JIT to not recompile and give the output of previous compiled item. This has become the key of JVM performance.
D. Garbage Collector (GC) :
Responsible cleaning used classes and objects which are no longer needed. It is kind of cleaner of all memory. Java GC has different algorithm like mark & sweep. It has different mode(Concurrent, parallel, generational). I will provide separate blog post on Java GC , how it works, how to choose application specific mode, how to twine GC.
The Execution engine is very critical part of JVM. So, for each application behavior we should configure all components of Execution engine with memory to run JVM smoothly for specific application.
Finally
we get the following picture
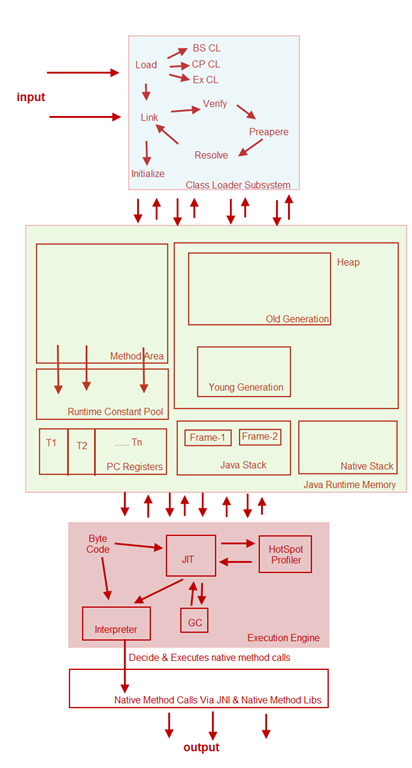
And From wikimedia,
Thanks..:)