In this post I will provide how to reproduce Java OutOfMemoryError : GC overhead limit exceeded . We will see how to reproduce and what we can see in monitoring tools. This is a continuing article of out of memory error/explanation.
I am using Oracle JVM 1.6 x64 & Oracle JVM 1.8 x64 on windows 7 x64/8gb ram/ 2.5Ghz Core i5 laptop.
Tools :
IDE :
- Eclipse
Profiling/Monitoring tool :
- Visual VM
- Jconsole (optional)
- Yourkit (optional)
Necessary JVM Parameters
I am using some JVM flags to get detail GC information and monitoring via JMX. Please see this post in step 1 for detail.
-verbose:gc -XX:+PrintGCDetails -XX:+PrintGCTimeStamps
-Dcom.sun.management.jmxremote=true
-Dcom.sun.management.jmxremote.port=3000
-Dcom.sun.management.jmxremote.authenticate=false
-Dcom.sun.management.jmxremote.ssl=false
-Djava.rmi.server.hostname=localhost
-XX:+HeapDumpOnOutOfMemoryError -XX:HeapDumpPath=D:\OOM
-Xmx100m
- xmx to limit heap to have quick error
Why GC overhead error?
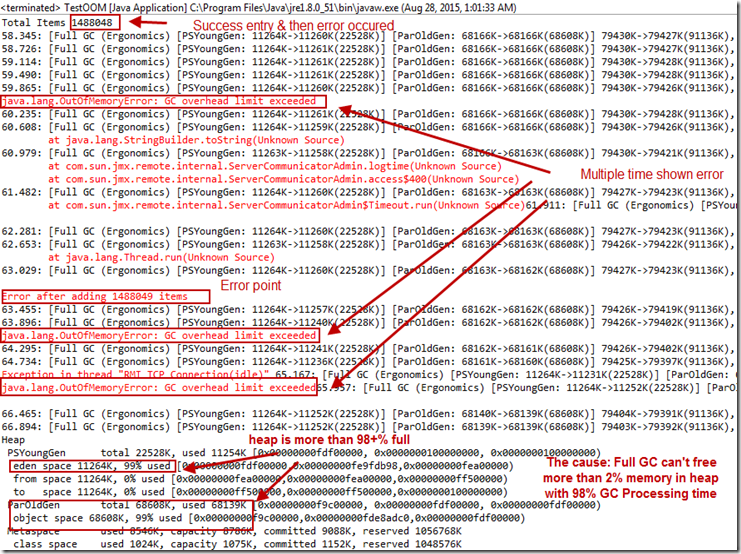
Due to GC is unable to free up the heap with its best efforts. The main cause is, GC is taking 98% of CPU time to cleanup heap where heap is not feeing up more than 2%. In our example, we will see GC overhead multiple time as heap is occupied after certain amount of item entry.
Again, to know about the error, you can visit this original post
Scenario:
Very simple scenario, I am adding a string in a map(it is costly, if we use array list, it will take more time) in an infinite loop.
public class GCOverheadOOM {
    private static Map aMap = new HashMap();
    public static void createGCOverheadOOM(){
        int i = 0;
        try{
            while (true) {
                aMap.put(i, "Shantonu adding String");
                System.out.println("Total Items "+i++);
            }
        }catch(Throwable e){
            System.err.println("\nError after adding "+ aMap.size()+" items");
            e.printStackTrace();
        }
    }
}
And from main method, call GCOverheadOOM.createGCOverheadOOM();
Source Code Github
Note : As this is a GC related error (overhead) , this error fully depends on GC algorithm. This code generates the error in default or parallel GCs. When I used different, I got slightly different one.
I have tried following jvm flags to select GC algorithm. Each at a one time
 -XX:+UseParallelGC
 -XX:-UseParallelOldGC
 -UseParNewGC
 -XX:+UseConcMarkSweepGC
 -XX:+UseParNewGC
 -XX:+UseConcMarkSweepGC
 -XX:+UseG1GC
 -Xincgc
 -XX:+UseSerialGC
 -XX:+UseParallelGC
Oracle has clear indication here
Error analysis in console:
- Error Occurred after 1488049 items added. We can see multiple OOM messages for each try by GC.
Dump Analysis in VisualVM (created at OOM ):
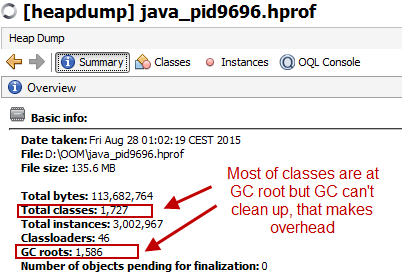
- I am opening heap dump from one of errors , from summary
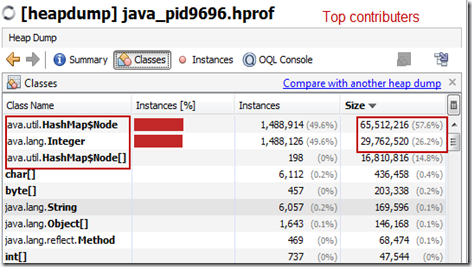
- Top contributors :
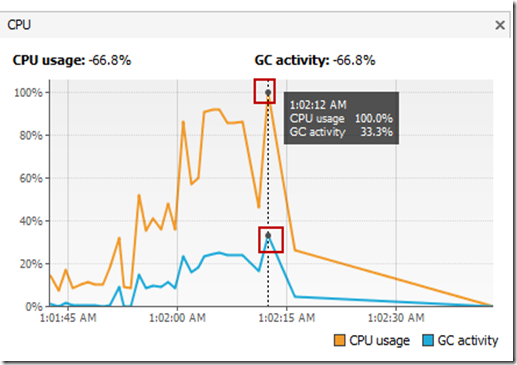
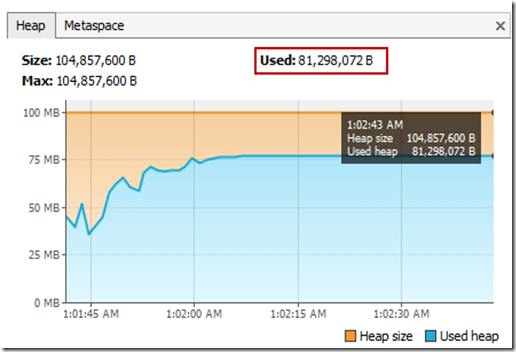
Visual VM Monitoring :
- GC before ending :
- Heap :
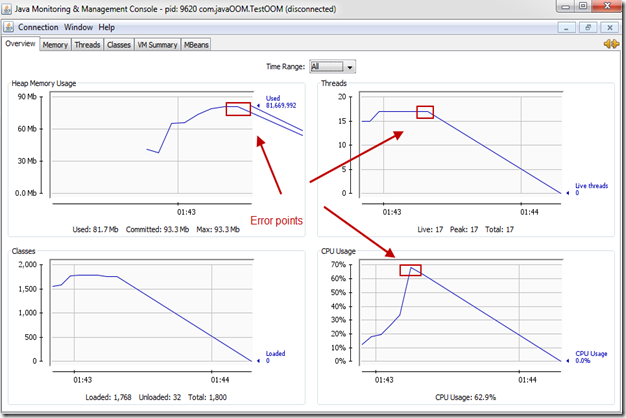
JConsole Monitoring : (overall)
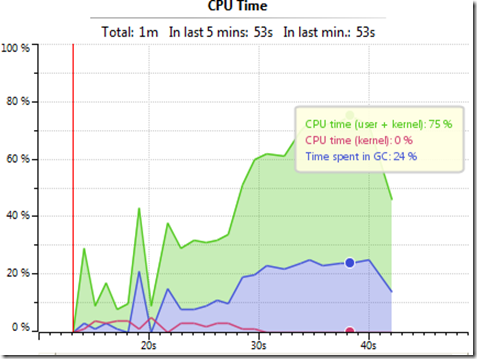
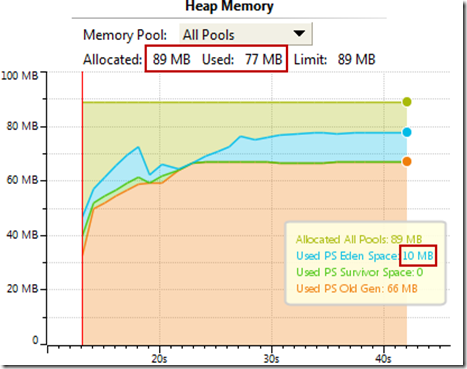
Yourkit Monitoring :
-
CPU usages :
-
Heap :
-
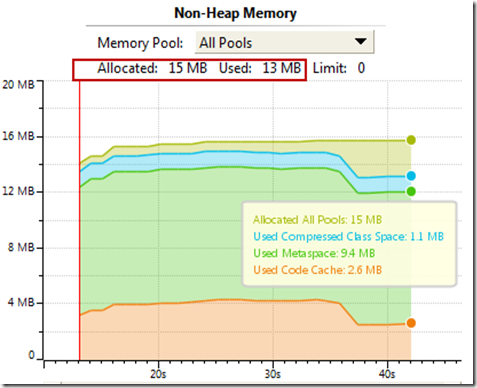
Non Heap :
Thanks.. :)