In this post I will provide how to reproduce Java OutOfMemoryError :Unable to create new native thread . We will see how to recreate and what are the impact in monitoring tools.
This is a continuing article of out of memory error/explanation.
I am using Oracle JVM 1.6 x64 & Oracle JVM 1.8 x64 on windows 7 x64/8gb ram/ 2.5Ghz Core i5 laptop.
Tools :
IDE :
- Eclipse
Profiling/Monitoring tool :
- Visual VM
- Jconsole (optional)
- Yourkit (optional)
I am using some JVM flags to get detail GC information and monitoring via JMX.
Now, for the nature of the error, it is easily untestable , due to PC’s limitations, JVM is unable to create new thread. Again, to know about the error, you can visit the original post.
Scenario :
I will write a function which will actually create many threads, start them, make them a demon thread(so that they are kept running) and store all thread in a collection.
This will make the number of thread grows and we can get the error.
Code :
public class ThreadOOM {
    public static void createOOMbyThread(){
        List<Thread> allThreads = new ArrayList<Thread>();
        try{
        while(true)
        {
            long startTime = System.currentTimeMillis();//to know timing is optional
            Thread aThread = new Thread(new Runnable(){// Anonymous runnable class
                  @Override
                  public void run() {
                      //System.out.println("Thread is running");
                    try {
                      while (!Thread.interrupted())//this will sleep the thread untill it is stopped.
                      {
                        Thread.sleep(1);
                      }} catch (InterruptedException ignored) {}}});
                aThread.setDaemon(true);
                aThread.setPriority(Thread.MIN_PRIORITY);
                allThreads.add(aThread);
                aThread.start();
            long endTime = System.currentTimeMillis();//to know timing is optional
            Thread.sleep(1);//if you need more wait, you can avoid to have quick impact
            System.err.println("Total Thread = "+allThreads.size()+" Required time(ms) = "+(endTime-startTime));
        }
        }catch(Throwable e){
            System.err.println("\nError at "+ allThreads.size()+" threads");
            e.printStackTrace();
        }
}}
And from main method , just call ThreadOOM.createOOMbyThread();
Full Source
Error analysis in console :
- Java 6 : Error happened in 3007 thread.
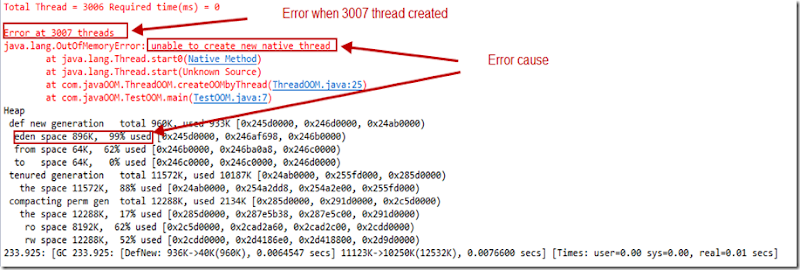
BTW, this number is not same always, it is based on CPU/Memory load. When I attached yourkit agent , it was less in numbers.
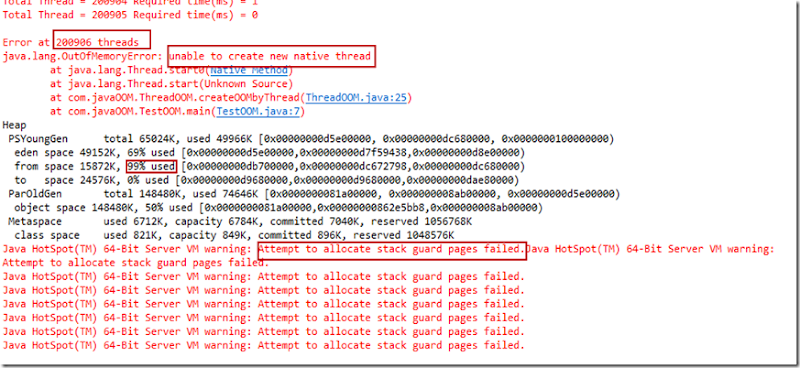
- Java 8 : Amazingly, Java 8 went up to 200906 thread. For less delay, I commented thread delay (2nd one) so that it moves faster. My PC become very slow resource usages were very very high. It seems Java 8 have separate mechanism to provide very high performance.
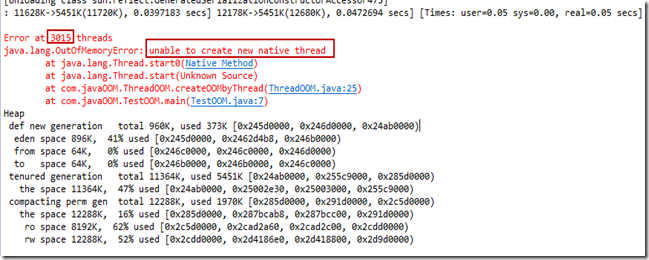
Java 6 Monitoring in Visual VM :
- I attached visual VM next time, and got error 3015 threads. So, the console error.
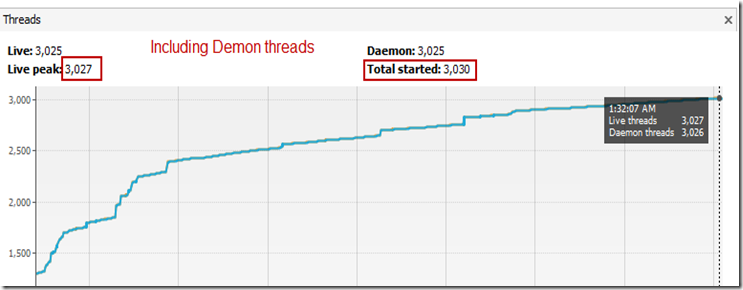
- As, JVM run user application by its own demon threads, so, in visual VM the count is little extra to 3030 (our created demon threads + predefined demon threads)
- And, if we look at GC activity, we can see how much CPU it was taking
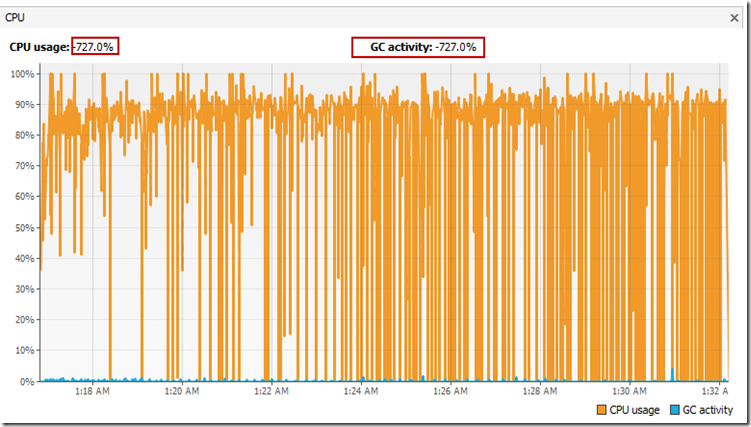
You may noticed, 727% , actually JVM consider single thread as 100% CPU usages. And if you have multiple core or thread, it will multiply.
In case of tweak/boost/overclock CPU it will increase the %. As my CPU was Core i5 2.5Ghz to boostable upto 3.1Ghz and when JVM starts it used to be running below 2Ghz. So, overall, it multiply single CPU thread performance and number of thread.
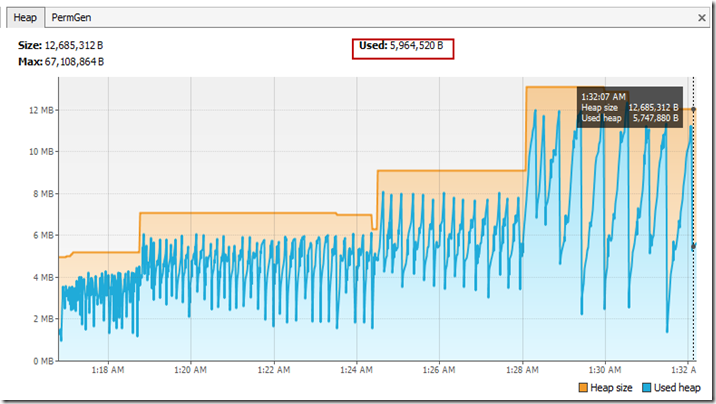
- And the heap usages
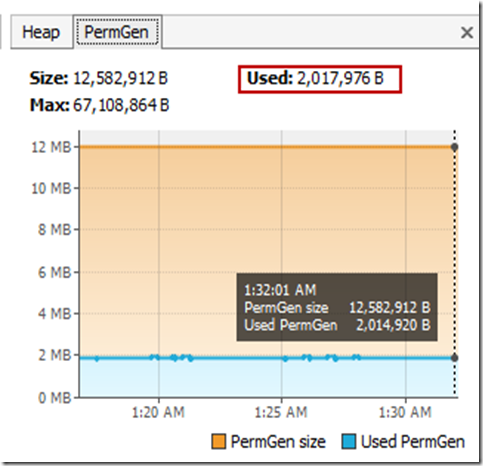
- PermGen usages
Java 6 Monitoring in Yourkit:
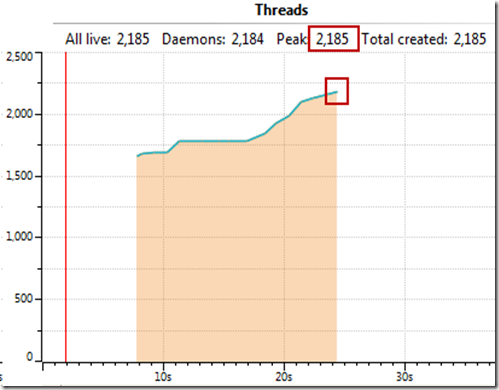
- When I attached your kit the thread OOM happened in 2228 threads and heap was this.
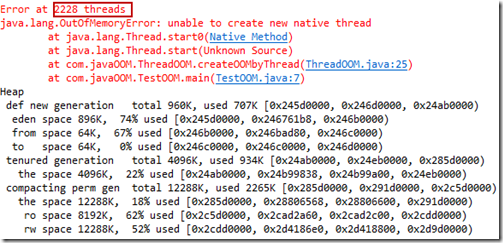
- As, yourkit has some initial delay to attach with application, if we see from your kit, we may see less number of thread. In my case it was 2185.
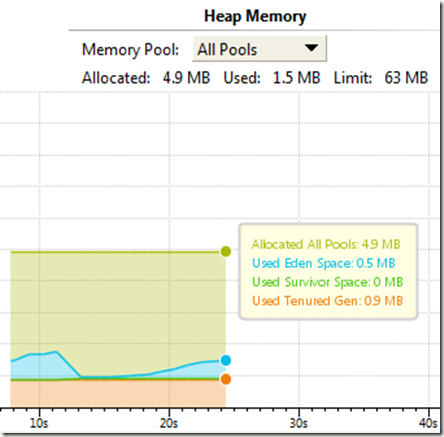
- And this was Heap usages
Java 8 Monitoring :
Visual VM :
- When I used visual VM, OOM occurred after 189772 threads but, it also cased
- stackoverflow error
- VisualVM crashed
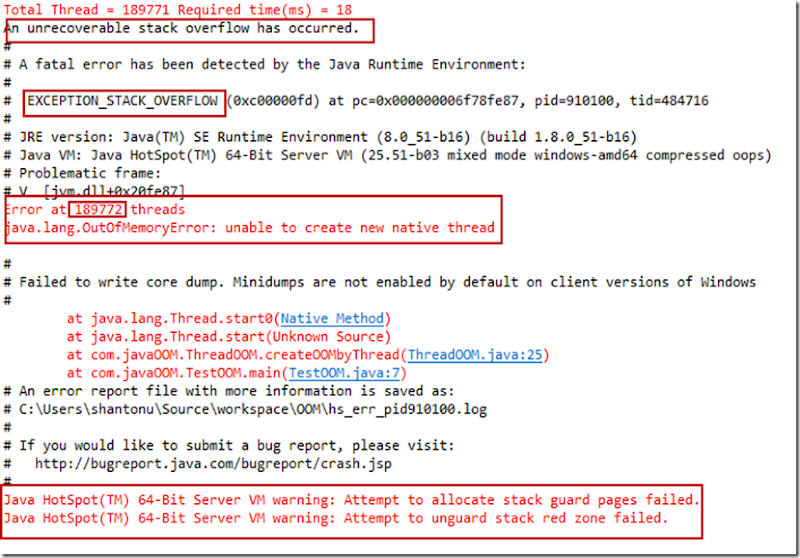
So, in that I should say, it was possible to create OOM with profiler but not possible properly to diagnosis. Similar story happened for Your kit also.
These are exceptions from log (in case you are interested), Internal exceptions (10 events):
Event: 4.782 Thread 0x0000000261194800 Exception <a 'java/lang/NoSuchMethodError': <clinit>> (0x00000000d797dd50) thrown at [C:\re\workspace\8-2-build-windows-amd64-cygwin\jdk8u51\3951\hotspot\src\share\vm\prims\jni.cpp, line 1598]
Event: 18.312 Thread 0x0000000261194800 Implicit null exception at 0x0000000002ba9985 to 0x0000000002ba9b7d
Event: 18.312 Thread 0x0000000261194800 Implicit null exception at 0x0000000002b86f40 to 0x0000000002b86fc1
Event: 20.038 Thread 0x000000057ff42000 Implicit null exception at 0x0000000002bfb3ab to 0x0000000002bff905
Event: 2377.189 Thread 0x0000000bc2404800 Exception <a 'java/net/SocketException': Connection reset by peer: socket write error> (0x00000000dc4f84a8) thrown at [C:\re\workspace\8-2-build-windows-amd64-cygwin\jdk8u51\3951\hotspot\src\share\vm\prims\jni.cpp, line 735]
Event: 2377.194 Thread 0x0000000bc2404800 Exception <a 'java/net/SocketException': Software caused connection abort: socket write error> (0x00000000dc4f8ab0) thrown at [C:\re\workspace\8-2-build-windows-amd64-cygwin\jdk8u51\3951\hotspot\src\share\vm\prims\jni.cpp, line 735]
Event: 2377.224 Thread 0x0000000bc2404800 Implicit null exception at 0x0000000002dd807f to 0x0000000002dd81f1
Event: 2377.229 Thread 0x0000000bc2404800 Exception <a 'java/net/SocketException': Software caused connection abort: socket write error> (0x00000000dc50fc10) thrown at [C:\re\workspace\8-2-build-windows-amd64-cygwin\jdk8u51\3951\hotspot\src\share\vm\prims\jni.cpp, line 735]
Event: 2377.232 Thread 0x0000000bc2404800 Exception <a 'java/net/SocketException': Software caused connection abort: socket write error> (0x00000000dc5102b8) thrown at [C:\re\workspace\8-2-build-windows-amd64-cygwin\jdk8u51\3951\hotspot\src\share\vm\prims\jni.cpp, line 735]
Event: 2377.233 Thread 0x0000000bc2404800 Exception <a 'java/security/PrivilegedActionException'> (0x00000000dc510468) thrown at [C:\re\workspace\8-2-build-windows-amd64-cygwin\jdk8u51\3951\hotspot\src\share\vm\prims\jvm.cpp, line 1382]
Yourkit :
I was trying to add yourkit to profiler , then I got error after 225167 threads. I found this in my console.
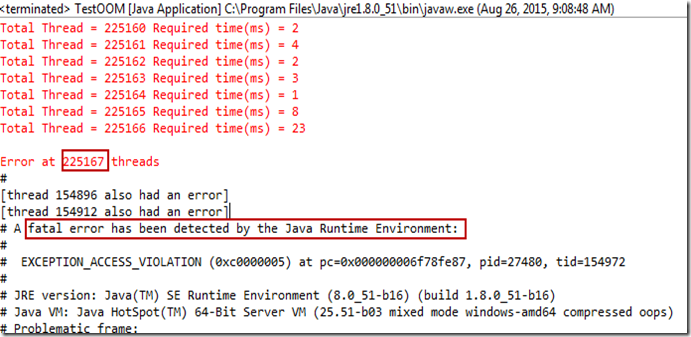
From JVM logs, I found this error EXCEPTION_ACCESS_VIOLATION.
It is easily understandable this error occurred due yourkit was trying to access JVM which was running with high PC resource and could not load JMX thread to connect with your kit.
So these are exceptions (last 10) from error log. (in case you are interested to know. Internal exceptions (10 events):
Event: 0.221 Thread 0x00000000021e8000 Exception <a 'java/lang/ArrayIndexOutOfBoundsException'> (0x00000000d606de18) thrown at [C:\re\workspace\8-2-build-windows-amd64-cygwin\jdk8u51\3951\hotspot\src\share\vm\runtime\sharedRuntime.cpp, line 605]
Event: 0.221 Thread 0x00000000021e8000 Exception <a 'java/lang/ArrayIndexOutOfBoundsException'> (0x00000000d606f650) thrown at [C:\re\workspace\8-2-build-windows-amd64-cygwin\jdk8u51\3951\hotspot\src\share\vm\runtime\sharedRuntime.cpp, line 605]
Event: 0.229 Thread 0x00000000021e8000 Exception <a 'java/lang/ArrayIndexOutOfBoundsException'> (0x00000000d60956e0) thrown at [C:\re\workspace\8-2-build-windows-amd64-cygwin\jdk8u51\3951\hotspot\src\share\vm\runtime\sharedRuntime.cpp, line 605]
Event: 0.236 Thread 0x00000000021e8000 Exception <a 'java/lang/ArrayIndexOutOfBoundsException'> (0x00000000d60a4fe8) thrown at [C:\re\workspace\8-2-build-windows-amd64-cygwin\jdk8u51\3951\hotspot\src\share\vm\runtime\sharedRuntime.cpp, line 605]
Event: 0.273 Thread 0x00000000021e8000 Exception <a 'java/security/PrivilegedActionException'> (0x00000000d60f2058) thrown at [C:\re\workspace\8-2-build-windows-amd64-cygwin\jdk8u51\3951\hotspot\src\share\vm\prims\jvm.cpp, line 1382]
Event: 0.273 Thread 0x00000000021e8000 Exception <a 'java/security/PrivilegedActionException'> (0x00000000d60f2210) thrown at [C:\re\workspace\8-2-build-windows-amd64-cygwin\jdk8u51\3951\hotspot\src\share\vm\prims\jvm.cpp, line 1382]
Event: 0.275 Thread 0x00000000021e8000 Exception <a 'java/security/PrivilegedActionException'> (0x00000000d60f5d08) thrown at [C:\re\workspace\8-2-build-windows-amd64-cygwin\jdk8u51\3951\hotspot\src\share\vm\prims\jvm.cpp, line 1382]
Event: 0.275 Thread 0x00000000021e8000 Exception <a 'java/security/PrivilegedActionException'> (0x00000000d60f5ec0) thrown at [C:\re\workspace\8-2-build-windows-amd64-cygwin\jdk8u51\3951\hotspot\src\share\vm\prims\jvm.cpp, line 1382]
Event: 0.441 Thread 0x00000000021e8000 Exception <a 'java/lang/ClassNotFoundException': javax/management/remote/rmi/RMIServerImpl_Skel> (0x00000000d6152888) thrown at [C:\re\workspace\8-2-build-windows-amd64-cygwin\jdk8u51\3951\hotspot\src\share\vm\classfile\systemDictionary.cpp, line 210]
Event: 332.215 Thread 0x00000000021e8000 Exception <a 'java/lang/OutOfMemoryError': unable to create new native thread> (0x00000000d790d350) thrown at [C:\re\workspace\8-2-build-windows-amd64-cygwin\jdk8u51\3951\hotspot\src\share\vm\prims\jvm.cpp, line 3016]
If you have any question, please feel free to ask.
Thanks .. :)