In this article we are going to see how can we run Jmeter tests using Jenkins. With jenkins we can run Jmeter in several ways. But, we only show the usages of Performance Plugins.
Jenkins is a CI server. It runs processes. It has different ways to run process. Using its different plugins we can Run Jmeter in following ways.
1. With Windows Batch (we will use this approach)
2. Linux shell
3. Groovy/Gradle
4. Maven Job
5. ANT job
6. Taurus/Blazemeter
(And many more , depend on what plugins you use)
As we know we can run Jmeter from command lines(see my old post). So, we use this command to run in windows environment.
Let't have some idea about this Performance Plugin. By the name it might be confusing that the plug in will be used for performance testing, actually it is not . It only shows current logs and results and differences with previous results to make as Trends.( Helpful for heuristic analysis). So, the steps will be,
1. Run Jmeter in standard Batch file execution
2. Add Several Jmeter reports Post build actions which will automatically show current results and Performance Trends. So, lets start.
Step 1 : Install Jenkins and Install Performance Plugins (standard way of plugins installation , I am not showing this details, get latest release hpi )
Step 2 : Open Jenkins in browser and go to dashboard.
Step 3 : Click New Item & Select Free style Project(you can select others type also, but I will use only windows batch, so this option is okay)
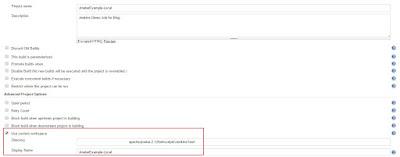
-Provide a Job Name , I gave "JmeterExample-Local"
Step 4 : Click Advance and select "Use custom workspace"
- Provide you script location in "Directory" text box
- You can provide name for this folder in "Display Name", I keep same as Job Name
Note : I used to make a separate folder as working directory where I keep test JMX, log file, result JTL and a Batch file(backup of the command that use in Jenkins, so that if Jenkins is down, I can still use single click execution from command line)
Step 4 : Click Add build Script Combo box and select "Execute Windows Batch Command"
This will show text box to add command.

This post will help to know about Jmeter command line commands. I am using following
@echo off
set user=20
set rampup=5
set iteration=3
jmeter -n -t JmeterPlan.jmx -Jusers=%user% -Jramp=%rampup% -Jiteration=%iteration% -l results.jtl
For this , I use simple Jmeter scripts like this,

Step 5: Now, the important part. Using Performance Plugins Reports. Click Add Post-Build action combo box and select "Publish Performance test result report".

This will enable a whole section to select different report. As this plugins include Jmeter and JUnit report types, we can see several type.

For this blog, I have used only "Jmeter" and "JmeterSummarizer" reports.

Select those report and provide file names. If you generate/save CSV format results, you can also select JmeterCSV report also to see.
Step 6 : In Threshold section, I use this for accepted criteria like as follows.

Step 7 : Save the job and run.
Form running build if you see console , you can see where the results are saved by jenkins.

inside job folder

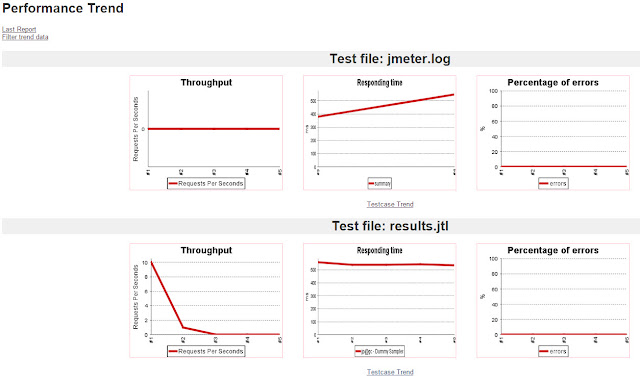
Inside of the job(not dashboard) you will be able to see a new report, "Performance Trend"

If you click "Performance Trend" you can see this result dashboard.
I hope dashboard charts are self explanatory. If you need to know details, comment please.
Thanks..:)
Jenkins is a CI server. It runs processes. It has different ways to run process. Using its different plugins we can Run Jmeter in following ways.
1. With Windows Batch (we will use this approach)
2. Linux shell
3. Groovy/Gradle
4. Maven Job
5. ANT job
6. Taurus/Blazemeter
(And many more , depend on what plugins you use)
As we know we can run Jmeter from command lines(see my old post). So, we use this command to run in windows environment.
Let't have some idea about this Performance Plugin. By the name it might be confusing that the plug in will be used for performance testing, actually it is not . It only shows current logs and results and differences with previous results to make as Trends.( Helpful for heuristic analysis). So, the steps will be,
1. Run Jmeter in standard Batch file execution
2. Add Several Jmeter reports Post build actions which will automatically show current results and Performance Trends. So, lets start.
Step 1 : Install Jenkins and Install Performance Plugins (standard way of plugins installation , I am not showing this details, get latest release hpi )
Step 2 : Open Jenkins in browser and go to dashboard.
Step 3 : Click New Item & Select Free style Project(you can select others type also, but I will use only windows batch, so this option is okay)
-Provide a Job Name , I gave "JmeterExample-Local"
Step 4 : Click Advance and select "Use custom workspace"
- Provide you script location in "Directory" text box
- You can provide name for this folder in "Display Name", I keep same as Job Name
Note : I used to make a separate folder as working directory where I keep test JMX, log file, result JTL and a Batch file(backup of the command that use in Jenkins, so that if Jenkins is down, I can still use single click execution from command line)
Step 4 : Click Add build Script Combo box and select "Execute Windows Batch Command"
This will show text box to add command.
This post will help to know about Jmeter command line commands. I am using following
@echo off
set user=20
set rampup=5
set iteration=3
jmeter -n -t JmeterPlan.jmx -Jusers=%user% -Jramp=%rampup% -Jiteration=%iteration% -l results.jtl
For this , I use simple Jmeter scripts like this,
Step 5: Now, the important part. Using Performance Plugins Reports. Click Add Post-Build action combo box and select "Publish Performance test result report".
This will enable a whole section to select different report. As this plugins include Jmeter and JUnit report types, we can see several type.
For this blog, I have used only "Jmeter" and "JmeterSummarizer" reports.
Select those report and provide file names. If you generate/save CSV format results, you can also select JmeterCSV report also to see.
Step 6 : In Threshold section, I use this for accepted criteria like as follows.
Step 7 : Save the job and run.
Form running build if you see console , you can see where the results are saved by jenkins.
inside job folder
Inside of the job(not dashboard) you will be able to see a new report, "Performance Trend"
If you click "Performance Trend" you can see this result dashboard.
I hope dashboard charts are self explanatory. If you need to know details, comment please.
Thanks..:)

