In this article we are going to know about KPI for a web application. We will get general idea on how to represent performance through KPI.
What is KPI ?
By Name , KPI refers to key performance indicator. A measurement which can shows application performance value as a whole. And, it can be represented in Graph or tabular format.
Think of KPI as abstract value which tells us about performance at a glance. We will compare with , some expected value and define acceptance of the application performances.
In general, if we think of KPI of a ball point pen, the KPI should refer to performance quality of the pen. And, performance quality of a pen is how well it can write, how long it can last etc.
So, KPI value should contain the reference value of “how well” & “How long”. So, we will provide quality measurement “how well” & “How long” and then we can add them to express KPI of the pen. You can add here color intensity that might change with a time to completely describe in pen case.
Note : we can also multiply them , this decision based on how we calculate KPI. Usually, multiplication express more importance in graph representation.
Kpi Example :
Let’ s have some example for web application : In general (unless you have any specific performance target) , a web application performance quality measure by
- How fast the response time
- How quick it can perform basic functionality(if we think for banking domain, it is business transactions)
- How much less it takes resource(CPU, memory, bandwidth)
More often, as web applications are multi-tier application, it is very logical to measure particular application performance. For server performance , it is used to measure
- How much is the Server Throughput (Hit/sec)
- How much is error rate (down time %)
So, let’s think about an any simple company internal application (not public facing) build on ASP.Net and has oracle DB to serve data. If we are measuring KPI, we should come up with some values that represent the performance.
For typical web product, it is considered, as less the size of the page is , the more it is performant. Same goes for as less bandwidth it takes, it is more performant.
As we are considering internal application, we may ignore bandwidth. So, the important measuring parameters are
- Response Time
- Size of each page/request(send + received)
And, to add server power with that, we should add -Server throughput
If you have Load balancing and several layers for data communication(we are assuming , we have) and, application gets different type of error due to Database and legacy system dependency, we should skip error rate. If we include this error%, it might be not logical for testing web servers only. So, we skip error% from key performance indication.(when we test individual servers, then it is logical. That means, webservice, DB, middle tire all separately).
Note : If it is customer facing website, we should not ignore error rate
So, we have 3 items. And, the meaning of each item is
- Response time : More response time less performance(inversely proportionate )
- Size : More size, less performance(inversely proportionate )
- Throughput: More throughput , more performance. (proportionate )
So, in here KPI for each step/transaction = Response Time x Size x(1/Throughput). In here, you can calculate throughput inversely and then multiply all. Or, add all.
- = Response Time x Size x Throughput inverse
- = Response Time + Size + Throughput inverse
(addition is also used to measure the value)
Note : To keep graph more align, we might have to change the unit, Example – millisecond to min/hour, changing items in Kilo/Mega range
So, KPI for a step/transaction in that application is KPI = RT*Size*TrInv
If we have multiple steps in test case (usually we have) and each of them have different priority, then we can include priority in KPI to keep things more realistic. (it will help in release to release comparison). Then the KPI = RT*Size*TrInv*Priority
So, let say in the test application , we have 5 transactions to test. And in current release, we have tested and get all KPI values from test tool. How can we measure , we are going good or bad (people provide large benchmarks which is not always useful). In that case , we should use KPI delta
KPI Delta = KPI expected- KPI from test results
In here expected KPI = the same KPI value calculation from expected results* (We should include SLA specification reflecting inside this expected KPI)
Kpi Formula example
Let say, Log in transaction. From test results we have found ,
- Response time = 5s (Expected was 2s)
- Size = 1.5Mb (expected was 1MB)
- Through put = 20 hit per sec (Expected was 25)
- Priority = 5(Measuring 1-10)
So,
- KPI = (51.5/20)5 = 1.875
- Expected KPI = (21/25)5=0.4
And
- Delta KPI = 0.4-1.875 = -1.475
- As Delta is below Zero, so, application performance is bad. And , really it is, as we failed to achieve all expected performance marks.
So, to measure application performance here, if we use single Performance metrics KPI Delta, we can express performance status in single graph. This graph will be shown
- Over time: X-Axis = time, Y-axis = KPI Delta . It means Performance status over time passes.
- Over user : X-Axis = User Increment, Y-axis = KPI Delta. It means Performance status over user increment.
Finally :
- For web service (as it is vastly used in web), I prefer
KPI = Response time * Error Rate* size of response*Throughput Inverse
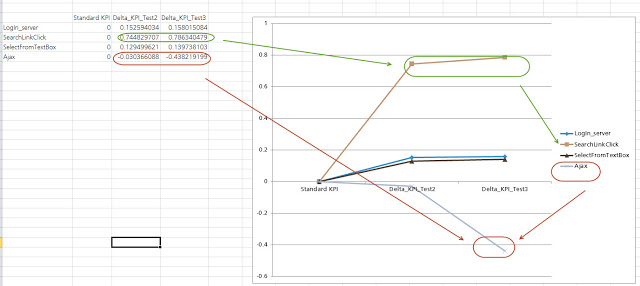
Example Charts :
In this example , we can see the performance trends.
- We have performed 3 tests . And test 1 considered as standard/baseline.
- 4 requests are there but, see the “Ajax” request. The performance trends says, it is getting low in performance from standard mark. Other requests seems higher , that means, trends is good.
Notes :
- If we have difficulties with Expected KPI, we can assume any version of application as standard. So in that case the
KPI Delta = KPI Of Previous Standard version- KPI from test results
-
While making test scripts, we need to keep arrangement in such way so that we can measure our KPI directly from raw results , which makes faster on reporting.
-
Regarding response time, from test tools, we can get Max, Min, Average, 90% response time. We might be confusion , what should we choose here. By nature, 90% response time is more accurate to real customer time, my preference is this.
But, if you application is very fast and scalable , have less initiation time, you can choose average also. You may choose MAX also when you need to evaluate performance for worst case scenario.
- Scalability is also a part of performance , but for measuring, it is ignored as that is related to capacity only.
Thanks, please let me know if you have any questions….:)