In this article we are going to learn about client side performance testing. And following engineering practice, we will see client side analysis and helping tools.
In old time (like 10-15 years ago), the web was totally different then now. At that time there were less type of client and less client side processing.
But, now a days, spatially after Web-0 booming, we see client has become more smarter, more functionality there as well as new innovation through new technology.
And, we have seen hardware become cheaper. So, client also started using local hardware not like as old times , fully depends on servers.
So, in performance engineering context, if we only do performance testing and monitoring of server, it does not make any sense. We will be missing a lot of performance issues based on client functionality.
To measure over all performance situation, it has become necessary to test for both Server and Client for any server-client application. So,
What is client-side performance testing?
When we say client side, it means it involves every thing involving client side activity.
That means, when we do performance testing of an application based on its client activity, that is client side performance testing.
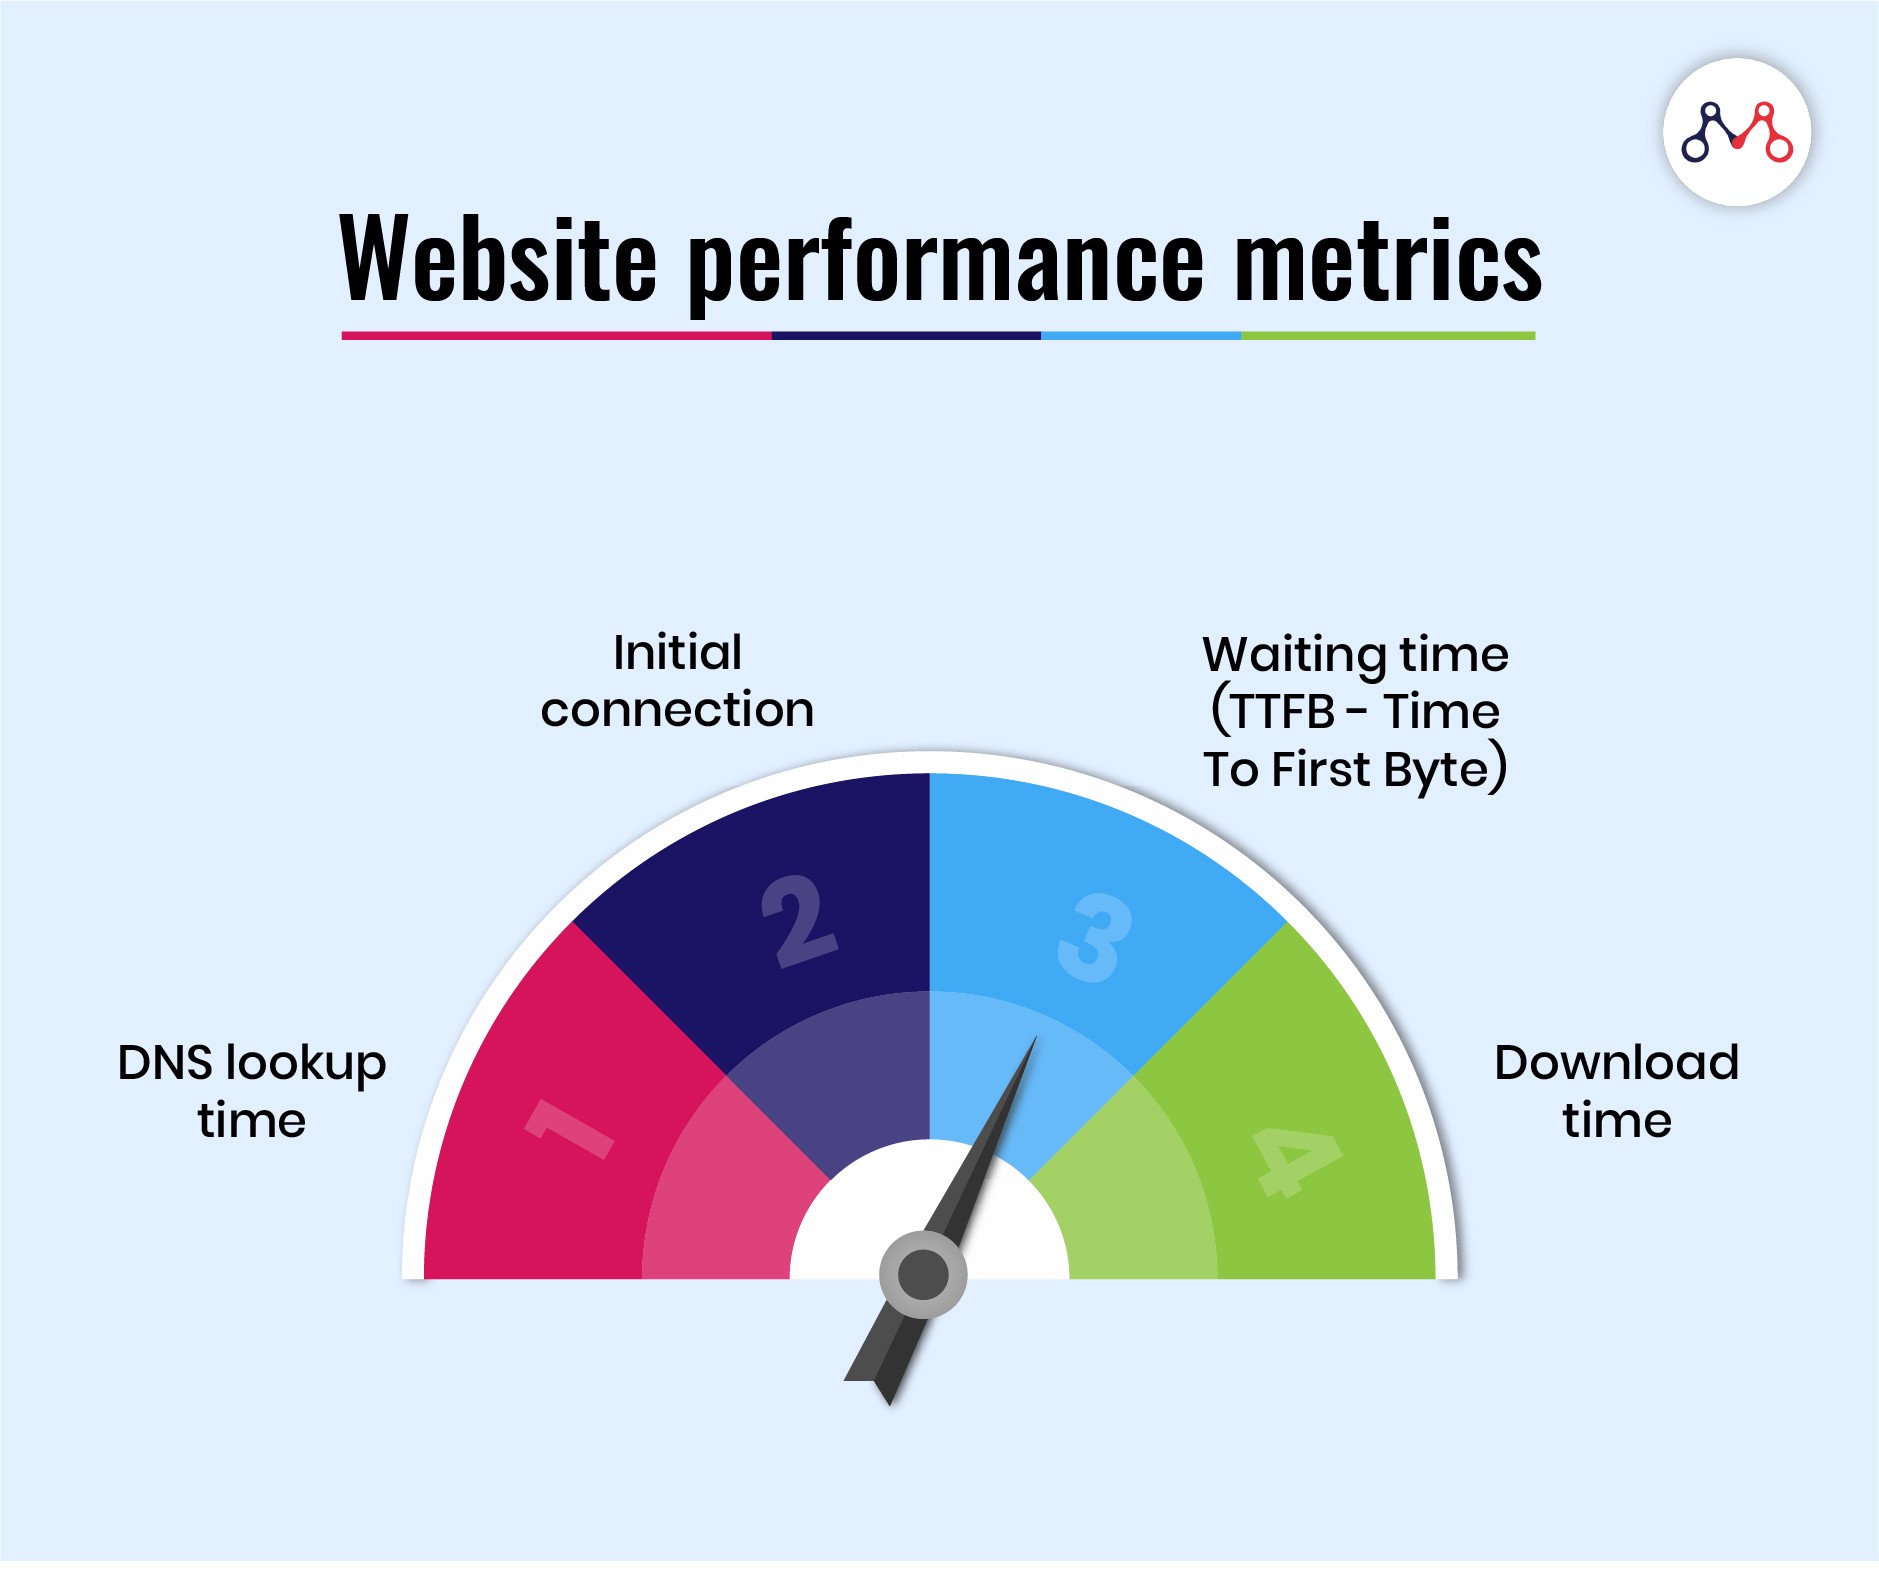
Example : if you consider an web application, client side performance will include the time of server execution and client side browser rendering, JS/AJAX calling, socket responses, service data population etc.
So, it can be differ based on operating systems, browser version, environment settings, firewall and antivirus, faster priority functional execution and user activity of course.
Goals of client-side Performance Testing
So, main targets for client side performance testing are
- Measuring actual Client timing for particular scenarios. It can be grouped as business transactions or can be measured with separate request for single user.
- Measuring single user time under different load and stress scenario. It is actually part of usability but it is included as performance test activity.
- Observe application behavior when server is down. Spatially due to application stress, when one or more servers are down, what are the situation . This might be some critical due to data integrity. I have tested for server back up time test after getting down.
This particular type is fully based on requirements. Like as in our current project, we run this test every day to see the progress.
We run regression test script(critical items only) so that we case see where is our business transition timing is going.
As you know from my previous post, type of performance testing, this will lead us to two basic part, performance measurement and performance monitoring or debugging.
Client-side Performance Measurement :
This part is tricky. In performance world. when we say performance tools, it all refers to server side performance measurement tool like loadrunner, JMeter etc. So, what about client side performance?
As, it was not popular before, it was mostly done by manually. Still it is one of the best practices to sit and test application critical functionality with a stop watch and measure that. I remember doing that in back to 2008-09. These are handy, no need automation , no need to know much technical stuffs. But, as it is manual time measurement and humans are not as perfect as machine for measuring time. So, it has error. So, there should be tool there.
Usually, before JMeterPlug-ins, there was no mentionable tool for web application performance test tools. We can use JMeterwebdriver plug-in to operate the same functionality that a human does and measure that time accurately. And, we can do same steps programmatically by using browser simulation. Like
- Selenum-webdriver-running in Java/C#/Python/Ruby/nodeJS with any supported test runner that measures.
- Ruby-watir-Gherkin-cucumber
- Java-robot simulation
- Java/c# – Robot framework
- Native action simulation tools/scripts(Auto IT/ Sikuli)
- Robotium/monkey runner/ Applium for Mobile client performance measurement.
JMeterhas this webdriver sampler in plugin , we can use that.
Client-side Performance Monitoring :
This means we have to have monitoring for our application as well as client resources.
Like as every operation systems, windows or linux has their own system internal tools to monitor resources.
And, as open source JMeter consultant, i should say we can use perfMon as JMeterplug-in to monitor client side (you may say localhost)
Now, for client side application monitoring, its’ really depend on application client type. If it is a TCP client, so you have to use TCP monitoring tool on the port which your application works.
Lets see some tools for web application protocol, http(s) for monitoring and analysis.
Browser Based Tools :
Most of modern browsers have build in tools. Like , IE or Chrome, if you press F12, you can see the tools. They follow w3 standards on navigation timing
- I like YSlow with firebug in firefox. (first install fire bug and then YSlow)
- Most popular , Page Speed by google.
- Tools from Chrome Extension like => Easy website optimizer, Developer tool, for REST web service Rest console , postman, Advance REST client etc.
3rd party Websites:
- GTMatrix , is one of my favorite
- Web Page Test is very useful
- Pingdom
Proxy :
For traffic monitoring i use
- Wireshark
- Fiddler
- YATT with winPicap
- Burp Proxy
- HttpWatch
- MaxQ,not focus on monitoring but you can use for that
- IEWatch
- ZaProxy
- CURL-LOADER
- Charles
3rd Party tools:
- Newrelic
- DynaTrace
- SolarWinds
- AppDynamics
- Nagios (Free)
- Zabbix
- MS Message analyzer
- WBench
- Hyperic Application & System Monitoring
- For web service testing, SOAP UI
And more and more….:).
Paid tools are good but i guess you can use a skilled person for using set of other tools rather paying them…:)
Helper tools:
For different web architecture, data come to client in different format. So, you should have
- Base64 decoder that supports different character set.
- URL decoder
- Decompressing tool
- File/Character format converters.
What to Monitor
Here we get the tools, but before using tools, we need to define what to monitor. Usually for an application we monitor.
- Application rendering time
- Specific JS/AJAX request/response/processing time
- User dependent request time
- Client side validation time
- Loading time for script/style/dynamic content.
- Total and request specific data coming and going
- How request are queued and processed(the behavior)
- Any exception based(serer/client) function or behavior.
- Business transaction or Particular request time
And for client resources.
- Browser & Application occupying CPU/Cache/Memory/Disk/IO/Bandwidth
- If application interact with any other service or application , we need monitoring that too.
Example: once our application uses the export function open with MS excel and in a point of time it crashes due to our application occupied so much memory , that excel could have memory to load up the big size data.
Test plan for client side execution:
Usually, a separate thread or users used to run the client side performance test to get the timing.
Not like as server side script that will run thousands of user and run parallel as it is specifically made for single user execution time for specific scenarios.
So, in the next post we are going to test a sample application using JMeterwebdriver and measure the time.
Thanks..:)