In this article we are going to see the jstat commands.
What is jstat?
jstat shows performance statistics for an JVM(Instrumented HotSpot). jstat use a identifier to get the JVM info.
Syntax
jstat [ generalOption | outputOptions vmid [interval[s|ms] [count]]
In here :
- generalOption : Options commons for all commands, I will define in bottom.
- outputOptions : Output specific options consisting a single stateOption and any of -t/-h/-J
- vmid : Virtual machine identifier, a string indicating the target JVM. I will explain in bottom.
- interval[s|ms] : Interval time seconds (s) / milliseconds (ms). jstat will produce its output at each interval.
- count : Number of samples to display.
jstat Options :
General Options :
- help : Shows help message. (same as other commands)
- version : Shows version information.(same as other commands)
- options : Shows list of statistics options
Output Options :
Determines the content and the format of jstat’s output. It has two part, stateOption and any of -t/-h/-J.
- Output formatted as table (columns are in space)
- t n : Shows time stamp(in second) as 1st column.
- h n : Sets the frequency of displaying header.
-
J(option) : Pass java option to the java app launcher.
-
stateOption: Defines the statistics info of jstat . It has following options
- class : Statistics on the class loader. Details of shown columns are
- Loaded : Number of loaded classes
- Bytes : Number loaded memory in Kb.
- Unloaded : Number of classes unloaded.
- Bytes : Number of Kbytes unloaded.
- Time : Time spent for class load and unload operations.
-
compiler : Statistics of the HotSpot Just-in-Time compiler. Columns details are
- Compiled : Number of compilation tasks.
- Failed : Number of compilation failed tasks.
- Invalid : Number of compilation invalidated tasks.
- Time : Time for compilation .
- FailedType : Last failed Compile type.
- FailedMethod : Last compile failed Class name and method.
-
gc : Statistics of garbage collected(GC) heap.Columns details are
- S0C : Current survivor space 0 (KB).
- S1C : Current survivor space 1 (KB).
- S0U : Survivor space 0 (KB).
- S1U : Survivor space 1 (KB).
- EC : Current Eden space (KB).
- EU : Eden space utilization (KB).
- OC : Current old space (KB).
- OU : Old space (KB).
- PC : Current permanent space (KB).
- PU : Permanent space (KB).
- YGC : Number of young generation GC Events.
- YGCT : Young generation GC Time.
- FGC : Number of full GC events.
- FGCT : Full garbage collection time.
- GCT : Total garbage collection time.
-
gccapacity : Statistics of generations and their corresponding spaces.Columns details are
- NGCMN : Min New generation capacity (KB).
- NGCMX : Max New generation capacity (KB).
- NGC : Current new generation capacity (KB).
- S0C : Current survivor space 0 capacity (KB).
- S1C : Current survivor space 1 capacity (KB).
- EC : Current eden space capacity (KB).
- OGCMN : Minimum old generation capacity (KB).
- OGCMX : Maximum old generation capacity (KB).
- OGC : Current old generation capacity (KB).
- OC : Current old space capacity (KB).
- PGCMN : Minimum permanent generation capacity (KB).
- PGCMX : Maximum Permanent generation capacity (KB).
- PGC : Current Permanent generation capacity (KB).
- PC : Current Permanent space capacity (KB).
- YGC : Number of Young generation GC Events.
- FGC : Number of Full GC Events.
-
gccause : Summary of garbage collection statistics (same to -gcutil but including last and current GC events). Additional columns other than gcutil are
- LGCC :Cause of last Garbage Collection.
- GCC : Cause of current Garbage Collection.
-
gcnew :Statistics of the behavior of new generation(in memory heap). Columns details are
- S0C : Current survivor space 0 capacity (KB).
- S1C : Current survivor space 1 capacity (KB).
- S0U : Survivor space 0 utilization (KB).
- S1U : Survivor space 1 utilization (KB).
- TT : Tenuring threshold.
- MTT : Maximum tenuring threshold.
- DSS : Desired survivor size (KB).
- EC : Current eden space capacity (KB).
- EU : Eden space utilization (KB).
- YGC : Number of young generation GC events.
- YGCT : Young generation garbage collection time.
-
gcnewcapacity : Statistics of the sizes of the new generations and its corresponding spaces. Columns details are
- NGCMN :Minimum New Generation Capacity (KB).
- NGCMX : Maximum New Generation Capacity (KB).
- NGC : Current New Generation Capacity (KB).
- S0CMX : Maximum survivor space 0 capacity (KB).
- S0C : Current survivor space 0 capacity (KB).
- S1CMX : Maximum survivor space 1 capacity (KB).
- S1C : Current survivor space 1 capacity (KB).
- ECMX : Maximum eden space capacity (KB).
- EC : Current eden space capacity (KB).
- YGC : Number of young generation GC events.
- FGC : Number of Full GC Events.
-
gcold : Statistics of the behavior of the old and permanent generations(in memory heap). Columns details are
- PC : Current permanent space capacity (KB).
- PU : Permanent space utilization (KB).
- OC : Current old space capacity (KB).
- OU : Old space utilization (KB).
- YGC : Number of young generation GC events.
- FGC : Number of full GC events.
- FGCT : Full garbage collection time.
- GCT : Total garbage collection time.
-
gcoldcapacity : Statistics of the sizes of the old generation. Columns details are
- OGCMN : Minimum Old generation capacity (KB).
- OGCMX : Maximum Old generation capacity (KB).
- OGC : Current old generation capacity (KB).
- OC : Current old space capacity (KB).
- YGC : Number of young generation GC events.
- FGC : Number of full GC events.
- FGCT : Full garbage collection time.
- GCT : Total garbage collection time.
-
gcpermcapacity : Statistics of the sizes of the Permanent Generation. Columns details are
- PGCMN : Minimum permanent generation capacity (KB).
- PGCMX : Maximum permanent generation capacity (KB).
- PGC : Current permanent generation capacity (KB).
- PC : Current permanent space capacity (KB).
- YGC : Number of young generation GC events.
- FGC : Number of full GC events.
- FGCT : Full garbage collection time.
- GCT : Total garbage collection time.
-
gcutil : Summary of garbage collection(GC) statistics. Columns details are
- S0 : Survivor space 0 utilization as a percentage of the space’s current capacity.
- S1 : Survivor space 1 utilization as a percentage of the space’s current capacity.
- E : Eden space utilization as a percentage of the space’s current capacity.
- O : Old space utilization as a percentage of the space’s current capacity.
- P : Permanent space utilization as a percentage of the space’s current capacity.
- YGC : Number of young generation GC events.
- YGCT : Young generation garbage collection time.
- FGC : Number of full GC events.
- FGCT : Full garbage collection time.
- GCT : Total garbage collection time.
-
printcompilation : HotSpot compilation method statistics. Columns details are
- Compiled : Number of compiled tasks .
- Size : Number of bytes of bytecode for the method.
- Type : Compilation type.
- Method : Class name and method name identifying the compiled method. The format for these two fields is consistent with the HotSpot -XX:+PrintCompilation option.
What is VMID
The virtual machine Identifier, in shortcut vmid. It’s a simple way to identify a vm.
syntax
[protocol:][//]lvmid[@hostname][:port][/servername]
Where :
- protocol : Communication protocol.
- lvmid : The local virtual machine identifier for the target JVM.(kind of pid of a OS)
- hostname :A hostname or IP address.
- port :The default port for communicating with the remote server. For the default rmi protocol, the port indicates the port number for the rmiregistry on the remote host.
- servername : It depends on implementation. Like as ,
Example :
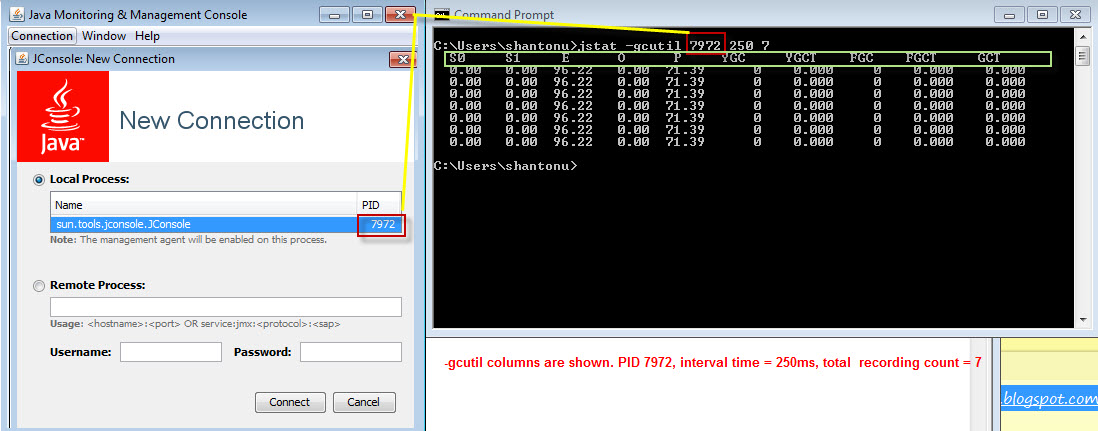
I have run jconsole application to get its PID and monitor jconsole itself for statistics. I have used this command where my PID(of jconsole)= 7972, interval time 250ms and 7 times recording.
jstat -gcutil 7972 250 7
Notes :
- For the optimized local protocol, this field is ignored.
- For the rmi protocol, it represents the name of the RMI remote object on the remote host.
Thanks…:)