In this article we are going to elaborate the jconsole commands.
What is jconsole?
jconsole command launches a GUI tool that enables monitoring and managing Java applications(on virtual machines) on a local or remote machine.
Syntax
jconsole [option] [connection..]
In here , a connection consists of java process ID of a local JVM or Name of host on which JVM is running and the port number specified by the system property or address of the JMX agent .
So , connection = pid or host:port or jmxUrl
jconsole options:
- interval=[n] : Set the update interval to n seconds (default = 4s).
- notile : Does not tile windows initially (for two+ connections).
- pluginpath (path to plugins): Specify a list of directories or JAR files for JConsole plugins.
- J(option) : Pass option to the Java virtual machine on which jconsole is running.
Connect JVM with Jconsole
- When we start jconsole, we get the Java Monitoring & Management console with New Connection wizard. I have started jconsole from command prompt, so we can see the jconsole in local process.
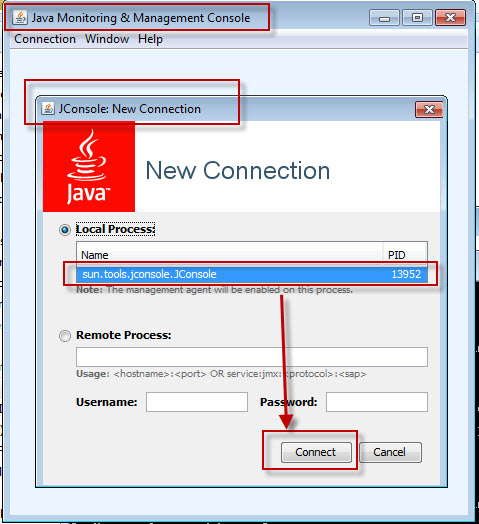
We can get remote process also.
- When we connect, we get detail information viewer. ( in this example, I have connected to jconsole itself).
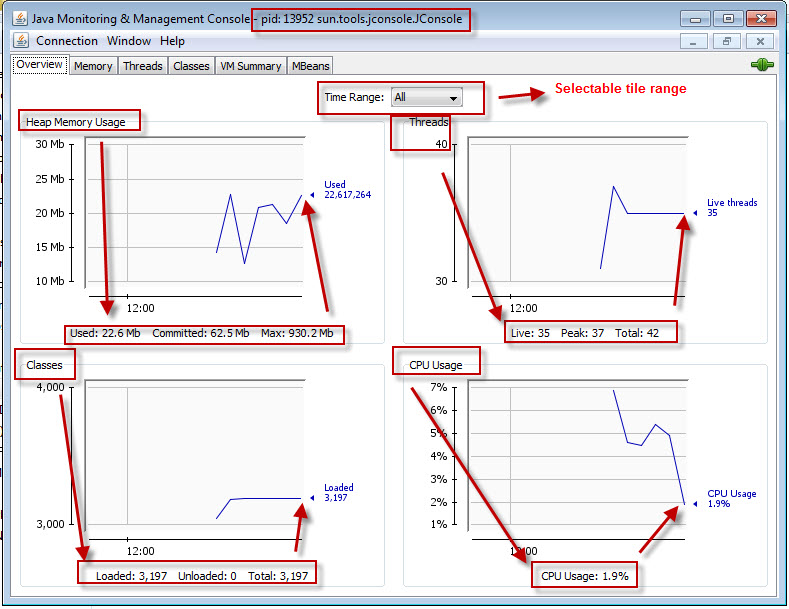
we can see the graphs of Memory, Threads, Classes, CPU used by VM. Detail of these information are displayed in separate tabs. We can select time range which define the display information’s time span.
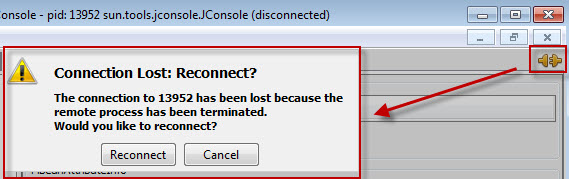
In right upper corner we can see the disconnect button used for disconnect with current VM.
Memory :
In this tab we see detail memory used.
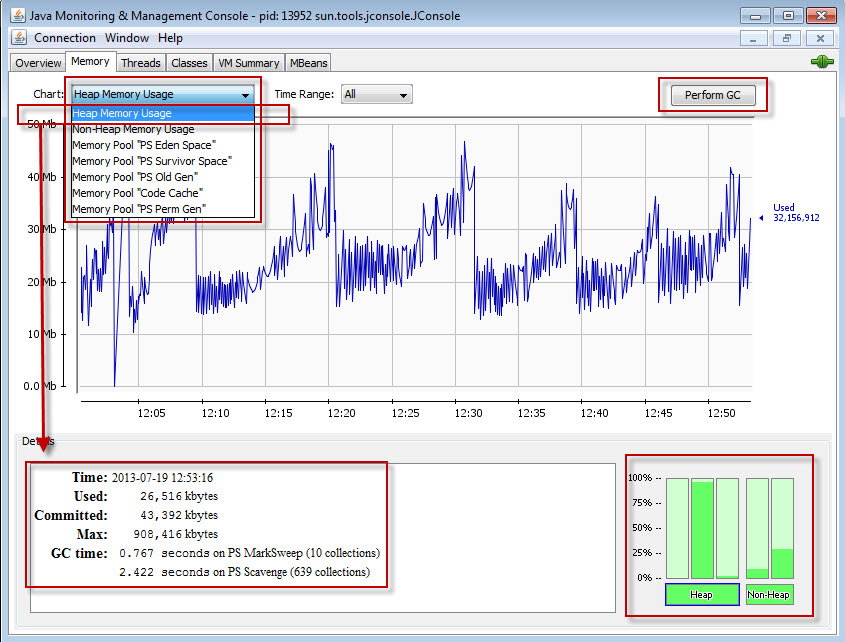
- Perform GC button performs garbage collection if we click on that. GC performs on Eden Space(heap), Survivor Space(heap), Tenured Generation(heap), Permanent Generation(non-heap), Code Cache(non-heap).
- We can see different type of memory information from selectable combo option
- In Down right, we can see Heap & Non-Heap memory info using a Bar chart.
- In Down Left , we can get detail memory info.
Threads :
In this tab we see detail Thread operations
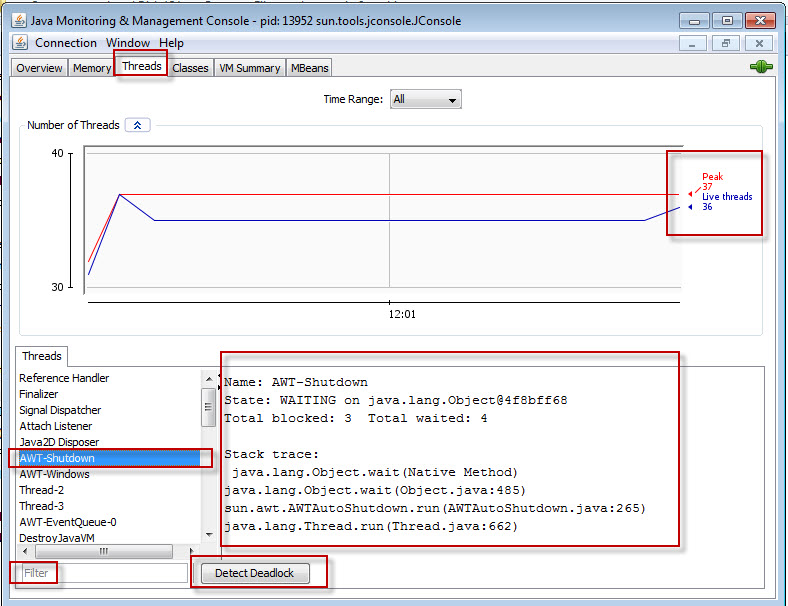
- We can select Time span for graph
- Full running threads are shown left bottom. If we select any one of them, we can see details. Filter can be done over the list
- A Detect Deadlock button is there to find dead lock threads.
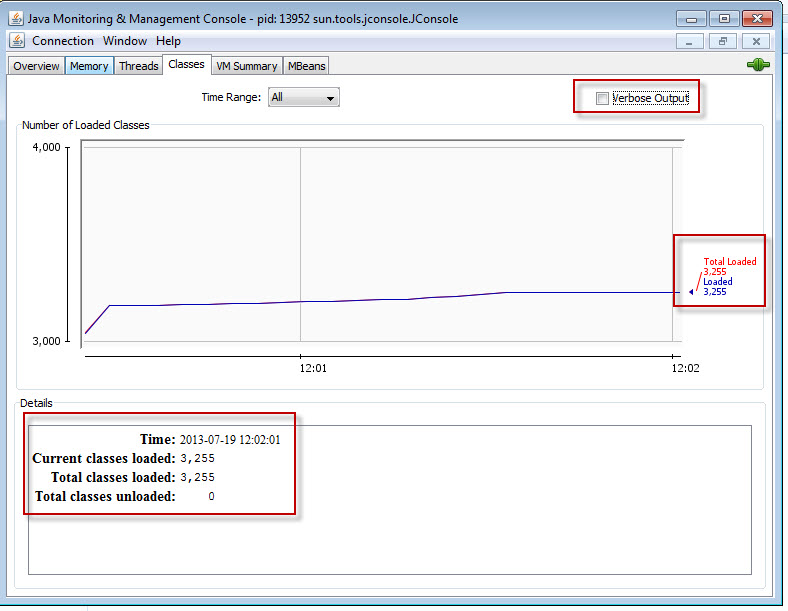
Classes :
In this tab we see running Classes
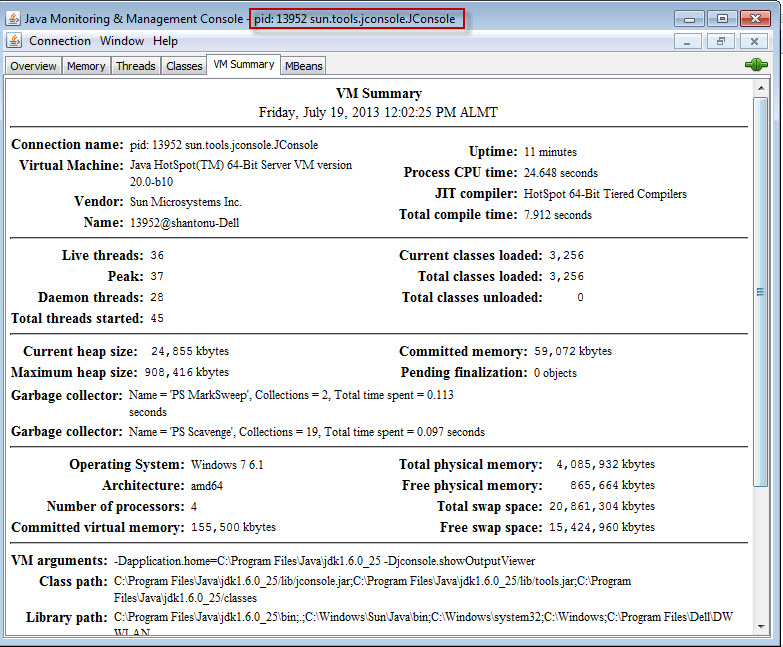
VM summary :
In this tab we see detail JVM information
MBeans :
In this tab we see about all the MBeans registered with the platform MBean server
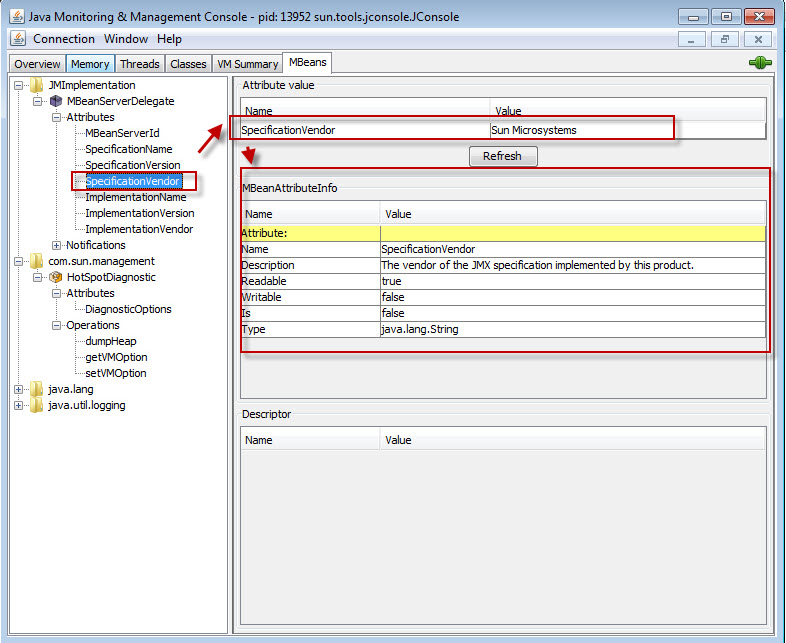
- If we select any of items, it shows detail property values of that item running in JVM. We use this for detail information about process running in VM.
For more details visit oracle docs.
Thanks…:)