In this article we are going to see how we can debug steps written in webdriver sampler.
This will help us finding specific step time as well as fail conditions. That means, if you are making script for long term project, it is must.
To make a good debug-able client side script, we can organize code in two ways.
Step 1 : Add WDS.sampleResult.subSampleStart(‘label of the step’) , this will create sub sample with the label you specified.
Step 2: Write your step to be performed in the browser.
Step 3 : Add WDS.sampleResult.subSampleEnd(true) to close this subsample.
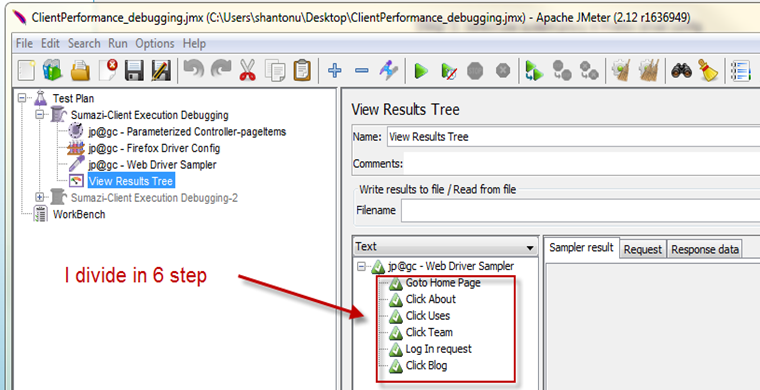
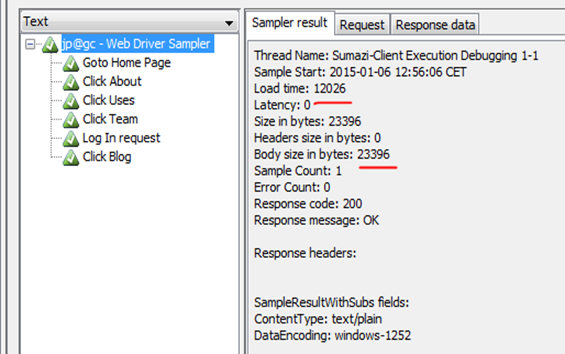
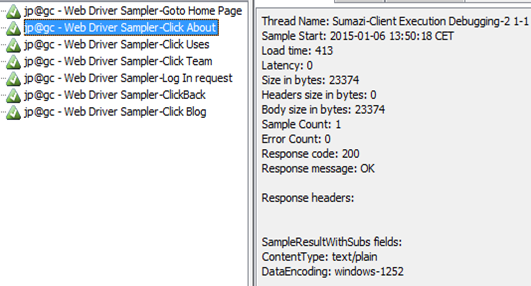
Let see view result tree :
This will help us finding specific step time as well as fail conditions. That means, if you are making script for long term project, it is must.
To make a good debug-able client side script, we can organize code in two ways.
1. Sub sampling the steps:
In my previous post you know how to active this. (by adding webdriver.sampleresult_class=true in user.properties). This is not needed for latest edition (plug in version 1.1.3)
So we will see how to divide them in sub samples.
Update : in current jmeter 5.3, the property will be
webdriver.sampleresult_class=com.googlecode.jmeter.plugins.webdriver.sampler.SampleResultWithSubs
Step 1 : Add WDS.sampleResult.subSampleStart(‘label of the step’) , this will create sub sample with the label you specified.
Step 2: Write your step to be performed in the browser.
Step 3 : Add WDS.sampleResult.subSampleEnd(true) to close this subsample.
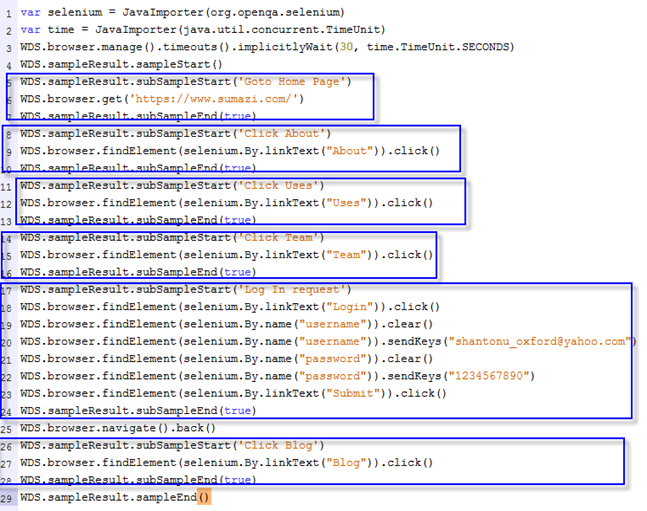
Its very simple. Lets apply to the scripts described in previous post. I will every process separate, like this
1: var selenium = JavaImporter(org.openqa.selenium)
2: var time = JavaImporter(java.util.concurrent.TimeUnit)
3: WDS.browser.manage().timeouts().implicitlyWait(30, time.TimeUnit.SECONDS) 4: WDS.sampleResult.sampleStart()5: WDS.sampleResult.subSampleStart('Goto Home Page')
6: WDS.browser.get('https://www.sumazi.com/')
7: WDS.sampleResult.subSampleEnd(true)
8: WDS.sampleResult.subSampleStart('Click About')
9: WDS.browser.findElement(selenium.By.linkText("About")).click()
10: WDS.sampleResult.subSampleEnd(true)
11: WDS.sampleResult.subSampleStart('Click Uses')
12: WDS.browser.findElement(selenium.By.linkText("Uses")).click()
13: WDS.sampleResult.subSampleEnd(true)
14: WDS.sampleResult.subSampleStart('Click Team')
15: WDS.browser.findElement(selenium.By.linkText("Team")).click()
16: WDS.sampleResult.subSampleEnd(true)
17: WDS.sampleResult.subSampleStart('Log In request')
18: WDS.browser.findElement(selenium.By.linkText("Login")).click()
19: WDS.browser.findElement(selenium.By.name("username")).clear()
20: WDS.browser.findElement(selenium.By.name("username")).sendKeys("shantonu_oxford@yahoo.com")
21: WDS.browser.findElement(selenium.By.name("password")).clear()
22: WDS.browser.findElement(selenium.By.name("password")).sendKeys("1234567890")
23: WDS.browser.findElement(selenium.By.linkText("Submit")).click()
24: WDS.sampleResult.subSampleEnd(true)
25: WDS.browser.navigate().back()26: WDS.sampleResult.subSampleStart('Click Blog')
27: WDS.browser.findElement(selenium.By.linkText("Blog")).click()
28: WDS.sampleResult.subSampleEnd(true)
29: WDS.sampleResult.sampleEnd() And if we run, we can see like this from view result tree.
This is because of this parts in the code
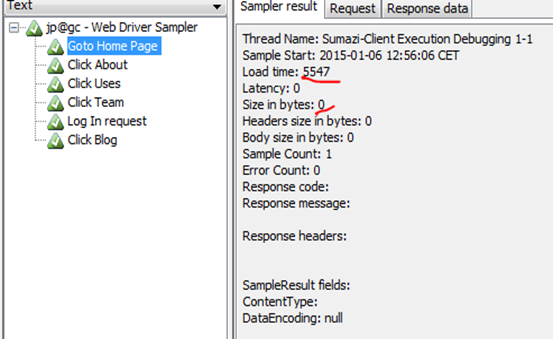
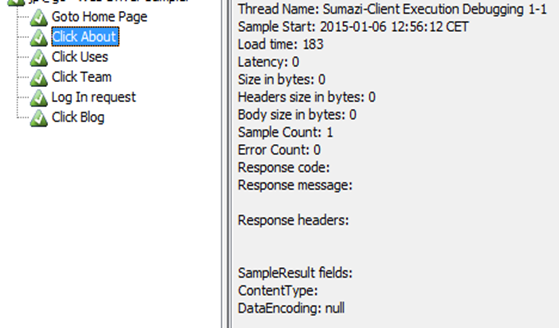
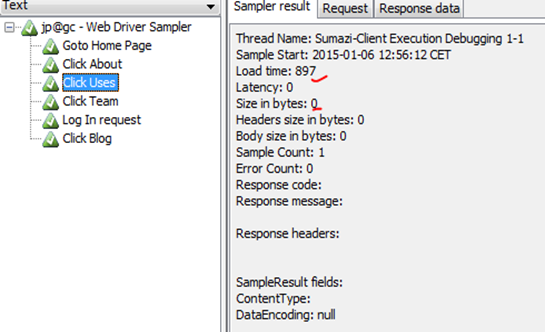
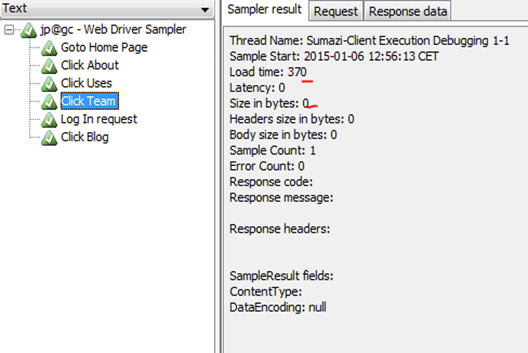
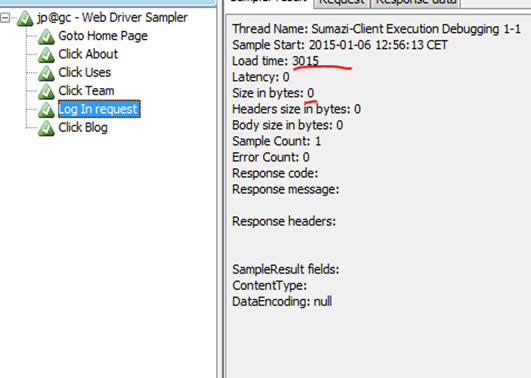
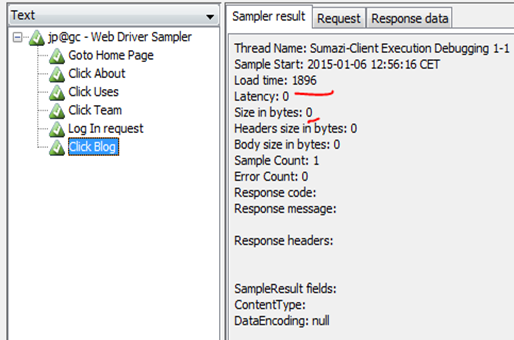
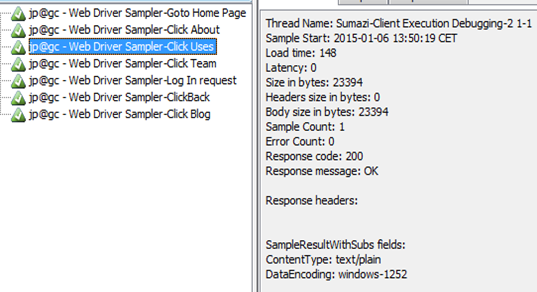
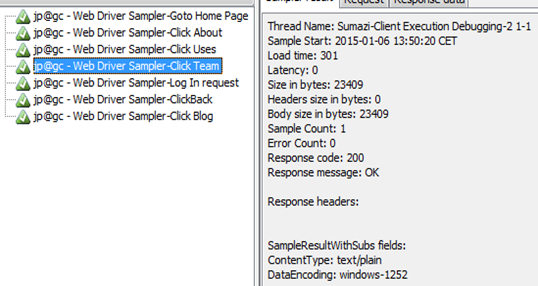
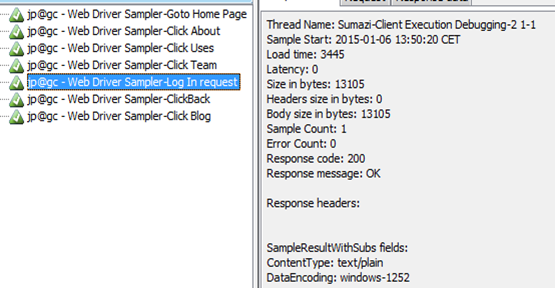
Now, lets see those individual test results from view result tree.
And, Finally the main sampler :
You might have noticed that those sub samplers do not have size value as it is part of main sampler.
Main, sampler is working like as Transaction which will be shown in table and results.
Benefits :
->You can get time for specific step without doing massive change in code. Just adding those boundary.
->It will not show in any listener table or graph, so your report format will be same. No effect.
Not Useful for :
-> If you want to measure size of the particular request. As it is part of a bigger request, it dont show specific size of the request. For this, you can follow like other method..
2. Keeping all steps in separate webdriver sampler :
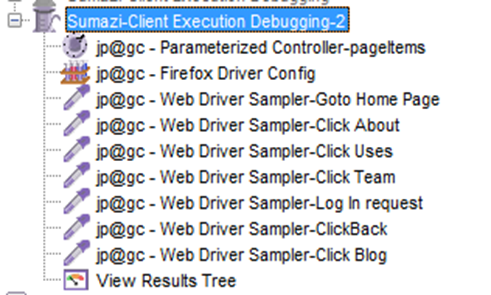
Now, lets divide those steps among multiple webdriver sampler. Like this.
Let see Go to Home Page: webdriver sampler which contains only request to visit home page.
1: var selenium = JavaImporter(org.openqa.selenium)
2: var time = JavaImporter(java.util.concurrent.TimeUnit)
3: WDS.browser.manage().timeouts().implicitlyWait(30, time.TimeUnit.SECONDS) 4: WDS.sampleResult.sampleStart()5: WDS.browser.get('https://www.sumazi.com/')
6: WDS.sampleResult.sampleEnd()or Log in request.
you might have followed, this is the time start and end. No sub sampling. BTW, you can apply sub sampling here also.
The full JMX file is here from Google Drive Share. Please see details scripts in there.
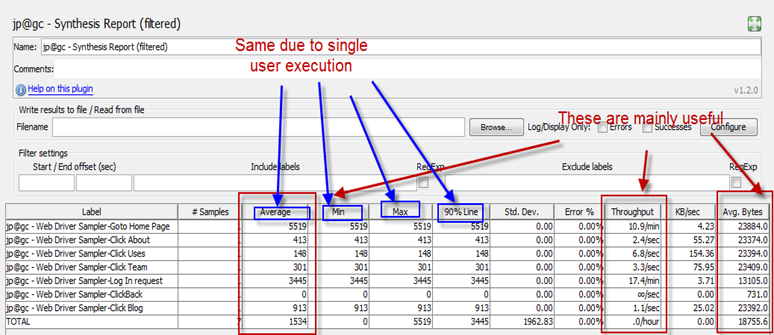
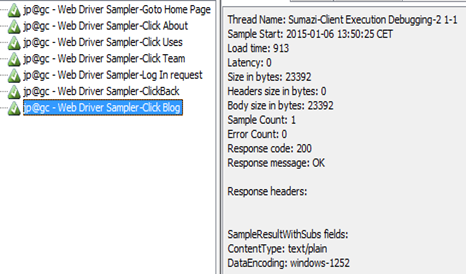
Now, lets run the script and see the view result tree. I am adding Synthesis Report to have more clear view. Form there..
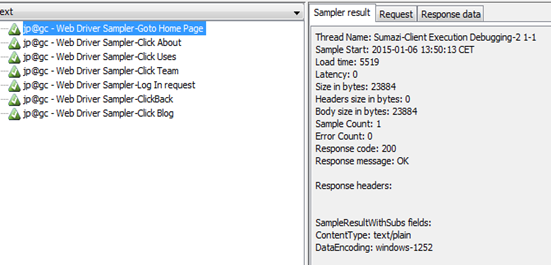
Let see view result tree :
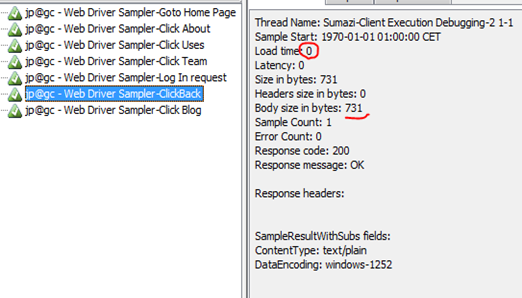
You need to look at this. This step is only for click Back from Browser, so time became Zero as it is not request from application , browser just gets preloaded page.
I use this method to write my script from beginning so that others can understand clearly and we can apply particular step specific formulas(like JS run or any function call that applies on that step only).
Benefits :
->We can see individual request size with time
->You can represent multiple request to gather using Transaction Controller like we do for server scripts. In this way, it is easy to measure transaction time.
Should be careful when
->Large Script to maintain
->Have per-defined report format.
Note : For difference in business, you might need to make this more specific on using. I am showing some ways to have more clear on code. These are easy to start. I will post on code style separately.
Thanks…:)
