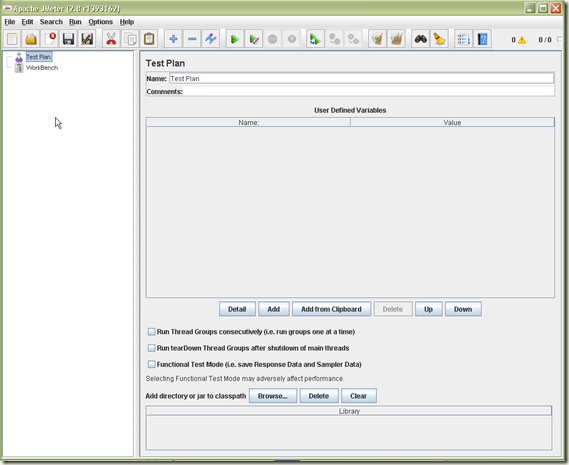
In this article we are going to be familiar with JMeter[A free web performance test tool]. This is going to be long, so I may not complete in one day. I will complete in incremental basis. So, lets start about basic.
What is JMeter? JMeteris a free tool made by using JAVA technology for testing web performance(load, stress).
How to install JMeter? As we know, it is based on JAVA, so we need java(version 1.5 or later). So
Step 1 : Install Java from here or from archives.
Step 2: Download latest JMeterfrom here.
Step 3: Extract downloaded file to a driver using any unzipping software.(I am using windows, so I prefer in c:\)[if you don’t have extracting software install from here]
Step 4: Go to Extracted directory and go to bin folder( in my case C:\apache-jmeter-2.8\bin) . Double click on jmeter.bat and you will see the JMeter GUI


ii. Edit

iii. Search

iv.Run

.... To be Continued...
What is JMeter? JMeteris a free tool made by using JAVA technology for testing web performance(load, stress).
How to install JMeter? As we know, it is based on JAVA, so we need java(version 1.5 or later). So
Step 1 : Install Java from here or from archives.
Step 2: Download latest JMeterfrom here.
Step 3: Extract downloaded file to a driver using any unzipping software.(I am using windows, so I prefer in c:\)[if you don’t have extracting software install from here]
Step 4: Go to Extracted directory and go to bin folder( in my case C:\apache-jmeter-2.8\bin) . Double click on jmeter.bat and you will see the JMeter GUI

Before starting testing practices in details, we will need a. Basic familiarity with JMeter GUI and b. Basic Idea on how to work with JMeter . And then we will know about reporting.
A. JMeter GUI.
Please see the following Screenshots where un explain options have standard functionality. If any one have detail functionality, they are Described in the screen shots.
i. File menu
ii. Edit
iii. Search
iv.Run
v.Options

vi. help

vi. help
B . Basic Idea on how to work with JMeter :
In JMeter, every script(or work) that we are working with should be under a Test plan. A JMeter test plan describes a series of steps will execute when run. A complete test plan will consist of one or more Thread Groups, logic controllers, sample generating controllers, listeners, timers, assertions, and configuration elements.
Thread Groups:
Logic Controllers:
Sample Generating Controllers:
Listeners:
Timers:
Assertions:
Configuration Elements:
.... To be Continued...