In this article we are going to see how we can get good reports in JMeter after tests. This is continuation post of this original article.
JMeter Reports
In JMeter, we can have different type of test results.
- CSV test results (default selection by plugins)
- JTL logs
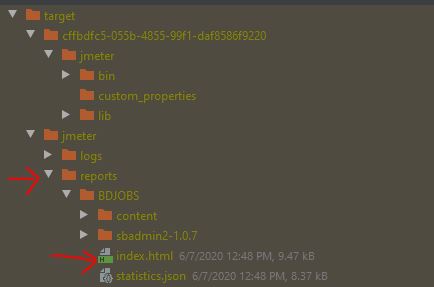
- HTML Results (modern report)
- JMeter Listener Graphs : Images/reports created by JMeter Listeners
Enabling HTML report
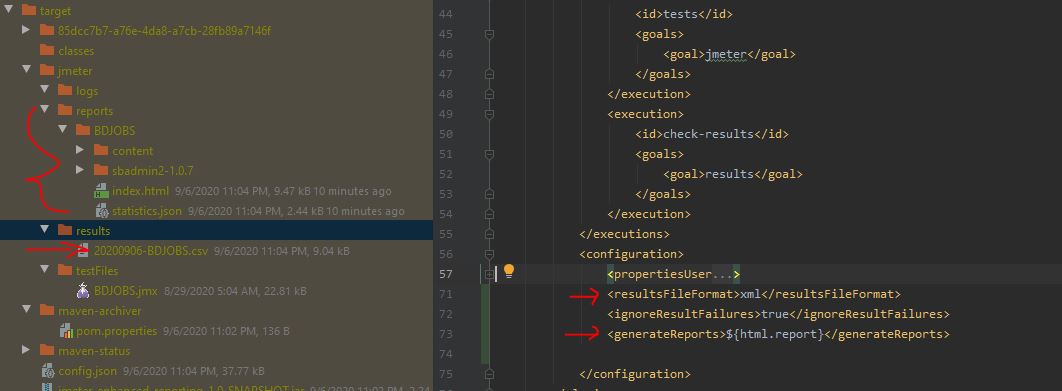
- To enable, html report, we can use this in configuration.
<generateReports>true</generateReports>
Result File Formatting
- To enable CSV results
<resultsFileFormat>csv</resultsFileFormat>
- To enable JTL results
<resultsFileFormat>xml</resultsFileFormat>
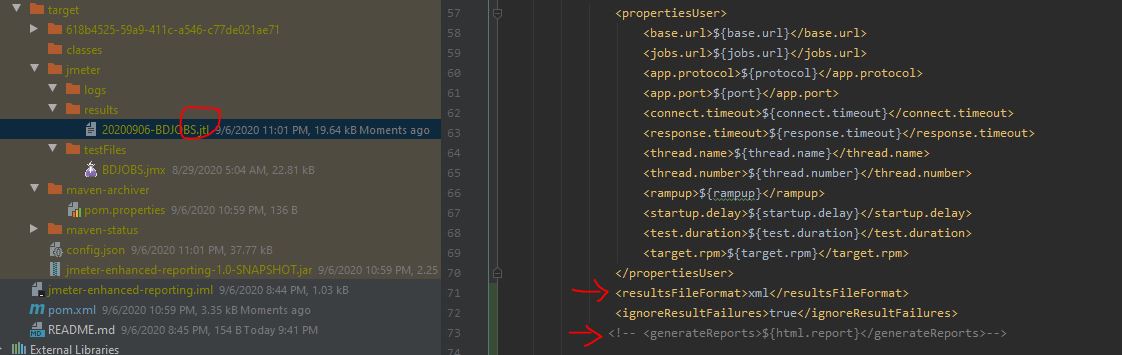
But, if you have enabled <generateReports> true, this will be always CSV in spite of XML settings.
- To disable timestamp from file name
<testResultsTimestamp>false</testResultsTimestamp>
- Add timestamp at the end of the results filename
<appendResultsTimestamp>true</appendResultsTimestamp>
- Specify date time format in result file
<resultsFileNameDateFormat>MMM, yyyy</resultsFileNameDateFormat>
- Result file folder location
<resultsDirectory>/results/jmeter</resultsDirectory>
- As maven build fails when detecting errors & it stops builds. To prevents this, we can ignore failure of results
<ignoreResultFailures>true</ignoreResultFailures>
- To prevent maven build error, its better to have some threshold values to test case where a certain number of errors can be accepted. I prefer 2% error is tailorable. To apply this, use
<errorRateThresholdInPercent>2</errorRateThresholdInPercent>
- Stop JMeter from printing console output
<suppressJMeterOutput>true</suppressJMeterOutput>
- To skip whole test
<skipTests>true</skipTests>
- To specify Log Level
<overrideRootLogLevel>debug</overrideRootLogLevel>
Finally report POM.XML
html-reporting-Project-source
- I have added following 3 html report properties for example which are optional
<jmeter.reportgenerator.report_title>Shantonu Example</jmeter.reportgenerator.report_title>
<jmeter.reportgenerator.overall_granularity>500</jmeter.reportgenerator.overall_granularity>
<jmeter.reportgenerator.exporter.html.series_filter>^(-success|-failure)?$</jmeter.reportgenerator.exporter.html.series_filter>
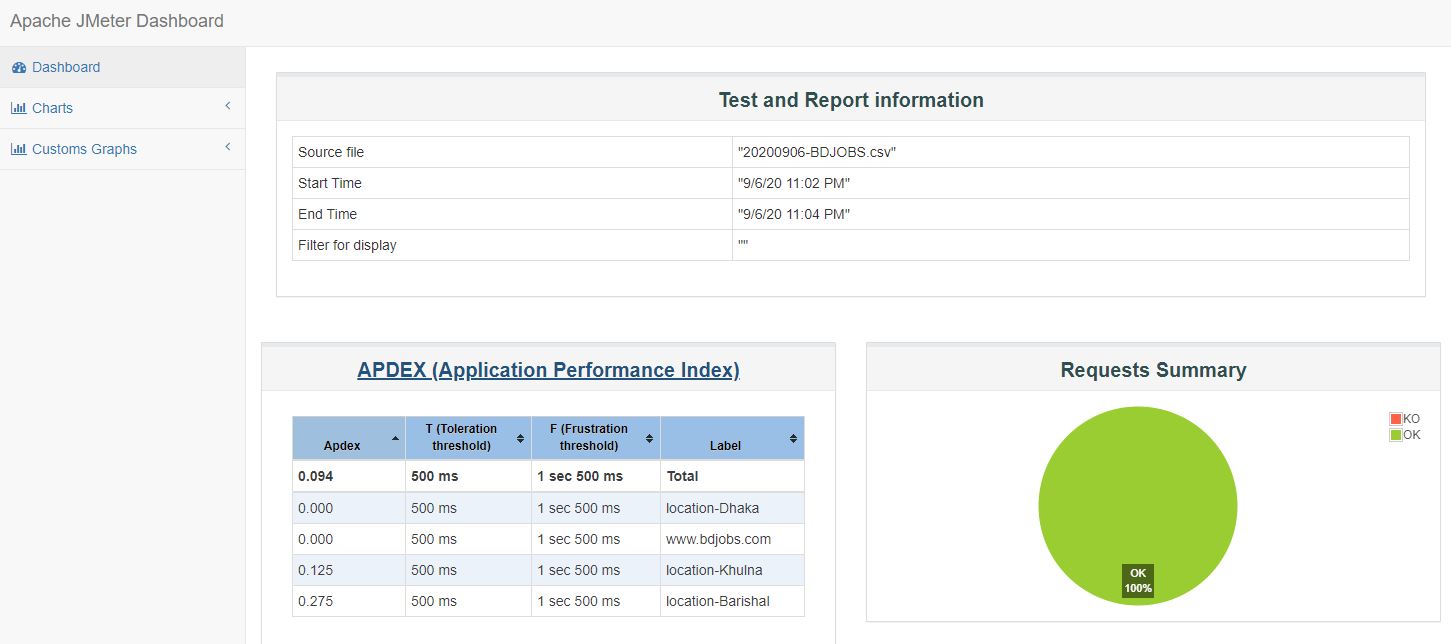
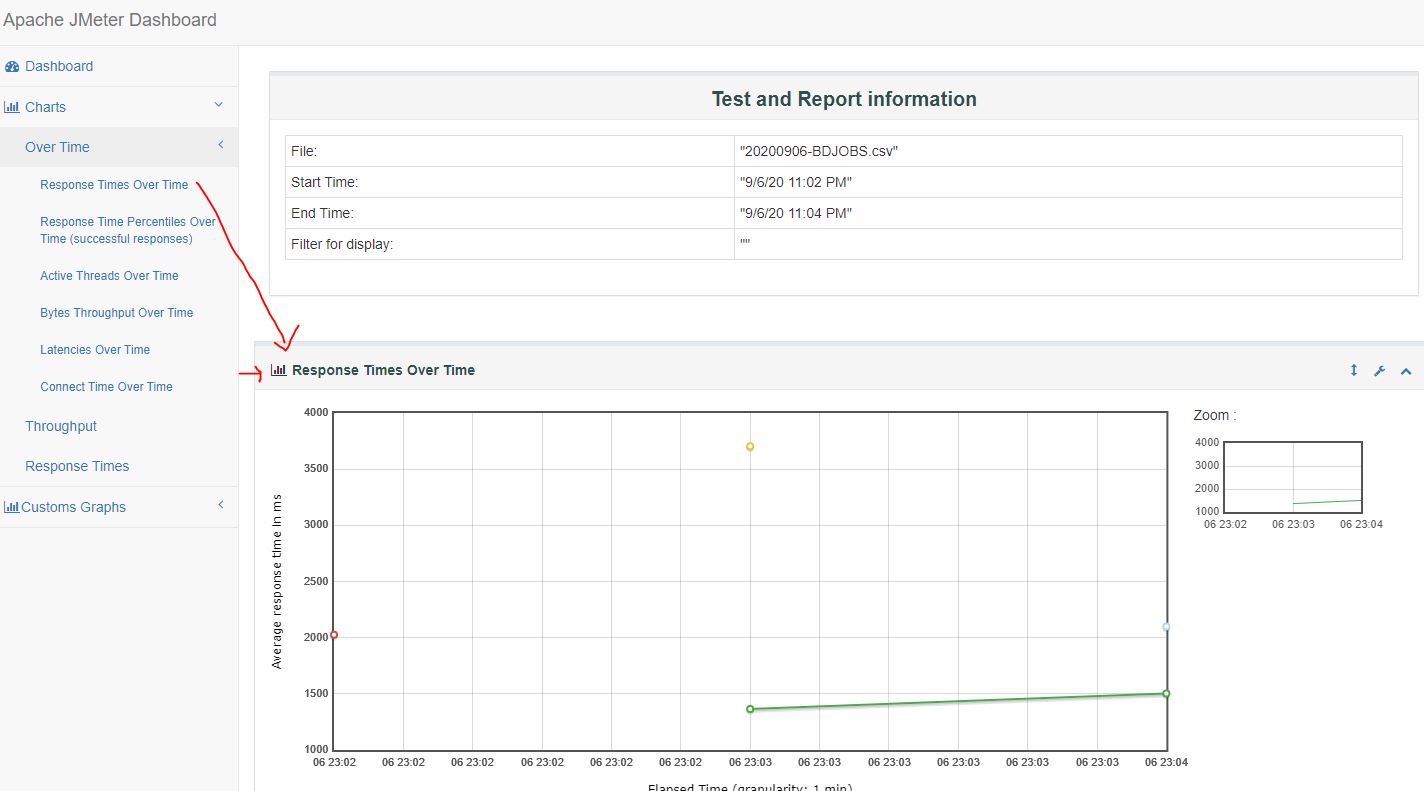
HTML Report UI
Creating Traditional Graphs
As we can always create graphs with JTL by CMD runner, another JMeter graph maven plugins available to generate this.
To use that plugins, we need to exclude html reporting and keep default XML (jtl) reporting format.
Adding Graph Plugins
<plugin>
    <groupId>de.codecentric</groupId>
    <artifactId>jmeter-graph-maven-plugin</artifactId>
    <version>0.1.0</version>
</plugin>
We need to add a configuration section and add type of graph one by one.
<configuration>
    <inputFile>${project.build.directory}/jmeter/results/*.jtl</inputFile>
    <graphs>
        <graph>
            <pluginType>ThreadsStateOverTime</pluginType>
            <width>1024</width>
            <height>768</height>
            <outputFile>${project.build.directory}/jmeter/results/graphs/ThreadsStateOverTime.png</outputFile>
        </graph>
    <graphs>
</configuration>
This plugins supports following Graphs(PNG):
- ThreadsStateOverTime = Active Threads Over Time
- BytesThroughputOverTime
- HitsPerSecond
- LatenciesOverTime
- ResponseCodesPerSecond
- ResponseTimesDistribution
- ResponseTimesOverTime
- ResponseTimesPercentiles
- ThroughputVsThreads
- TimesVsThreads = Response Times VS Threads
- TransactionsPerSecond
We can add all graphs or only necessary graphs. To show in example, I have added all supported graphs in project.
Finally Graph POM.XML
Old Graph Project Source
Lets Run & generate Graphs
- If we want to generate Graphs, we need to run
mvn JMeter-graph:create-graph
And we can see graphs generated in configured folder. In my case ${project.build.directory}/jmeter/results/graphs/
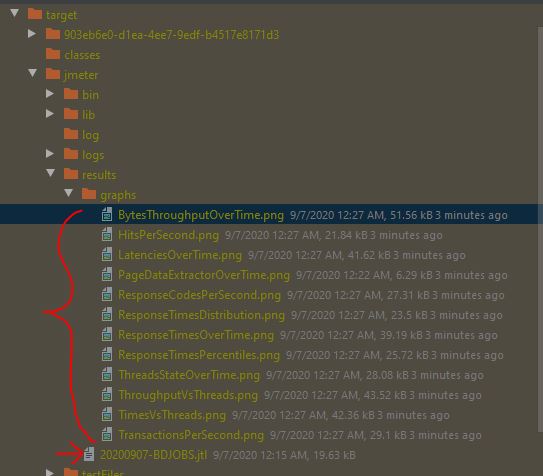
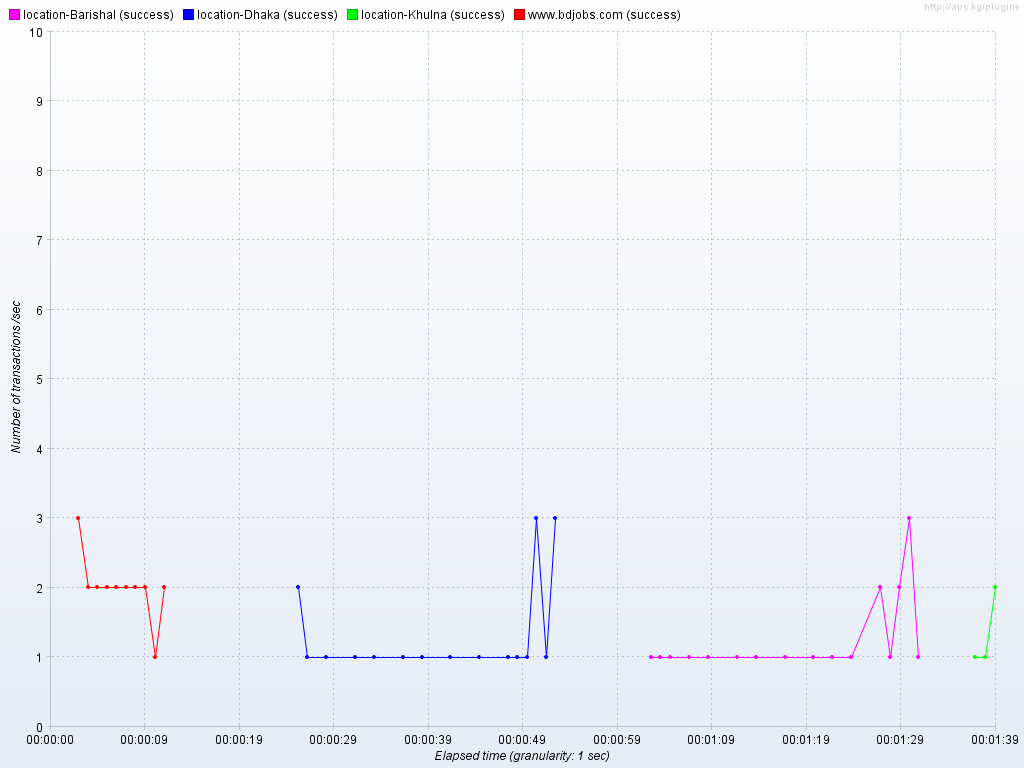
From my example , I am adding all generated Graphs.
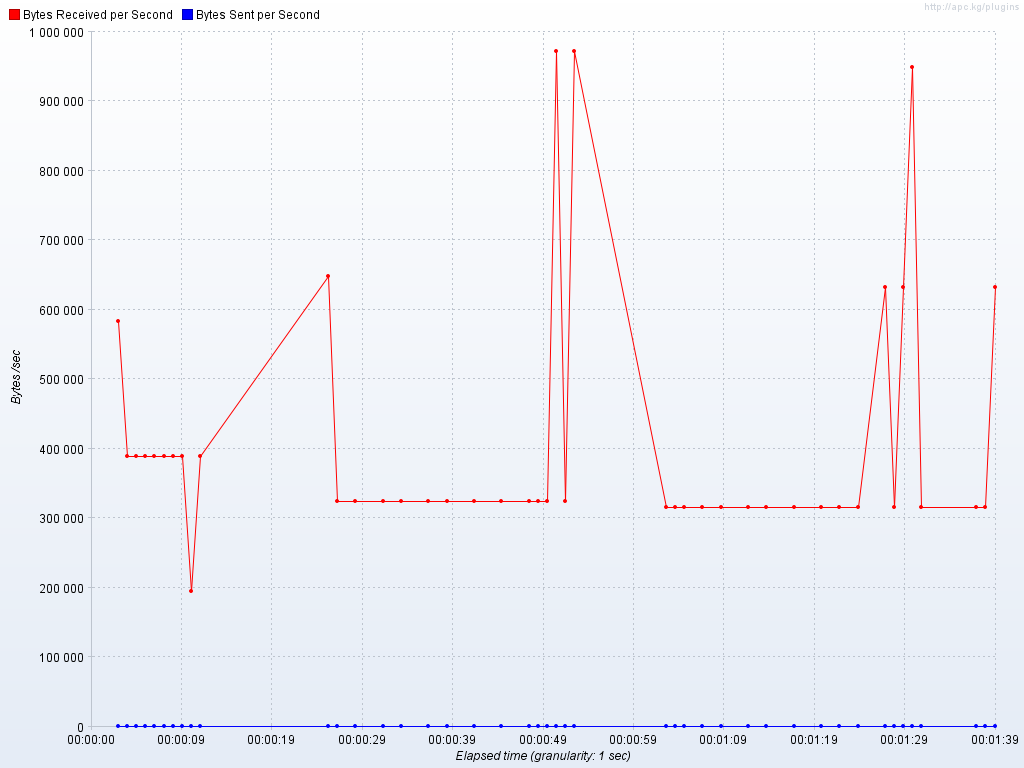
- BytesThroughputOverTime
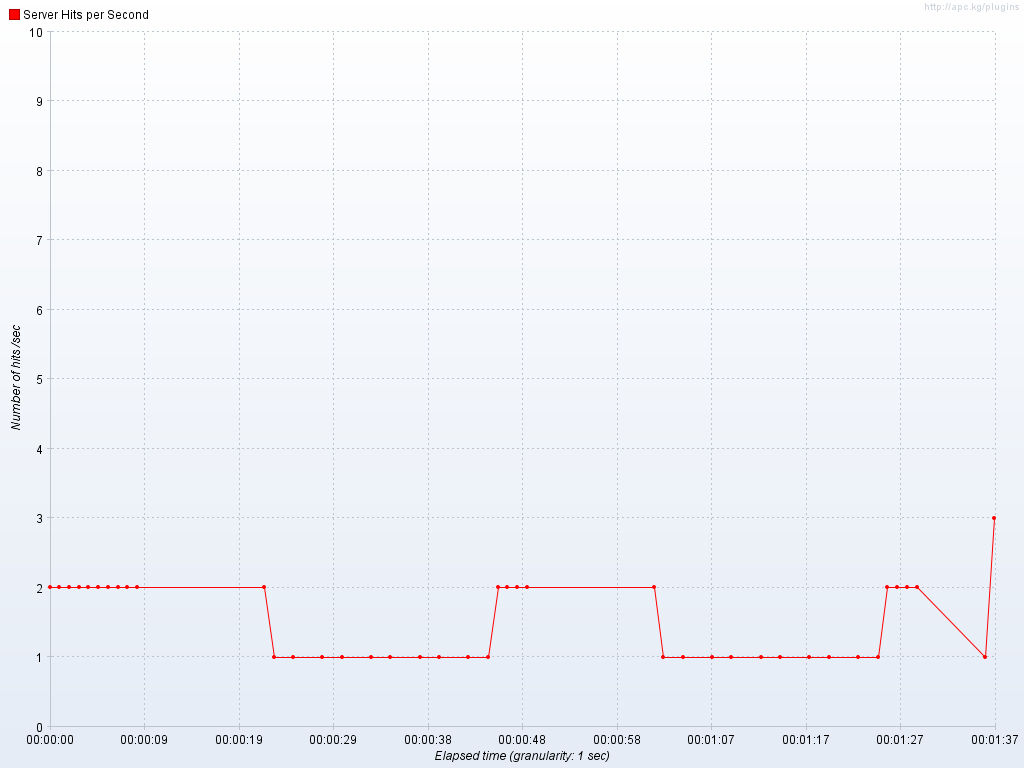
- HitsPerSecond
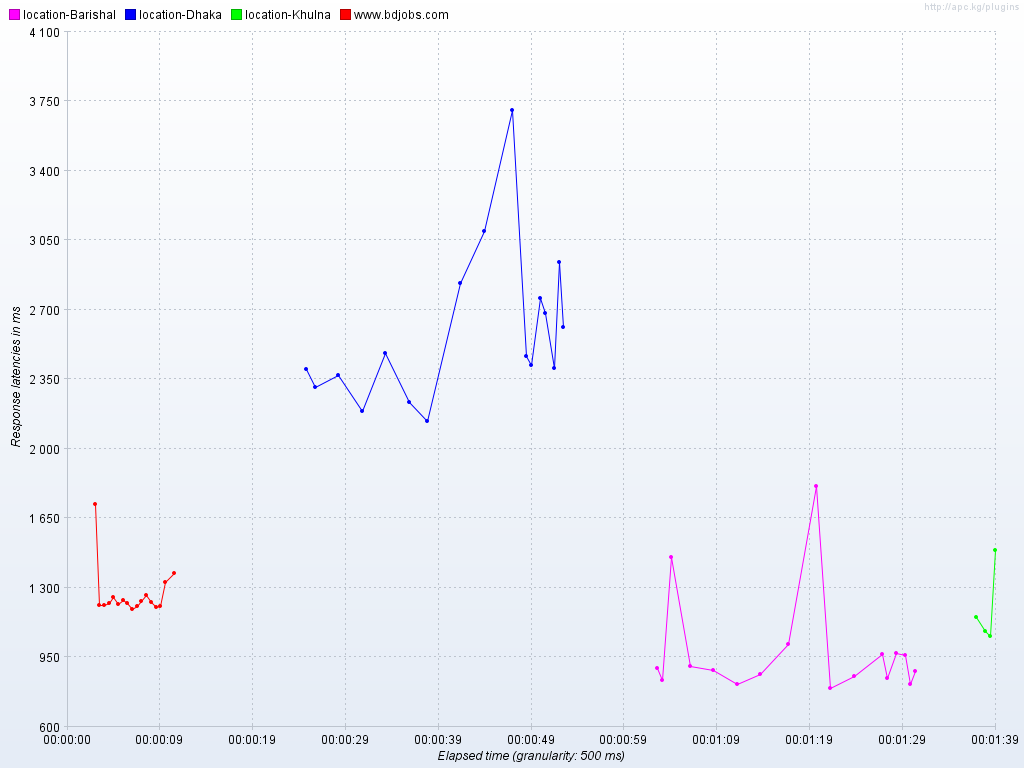
- LatenciesOverTime
- PageDataExtractorOverTime wont have any data to show, so, its blank.

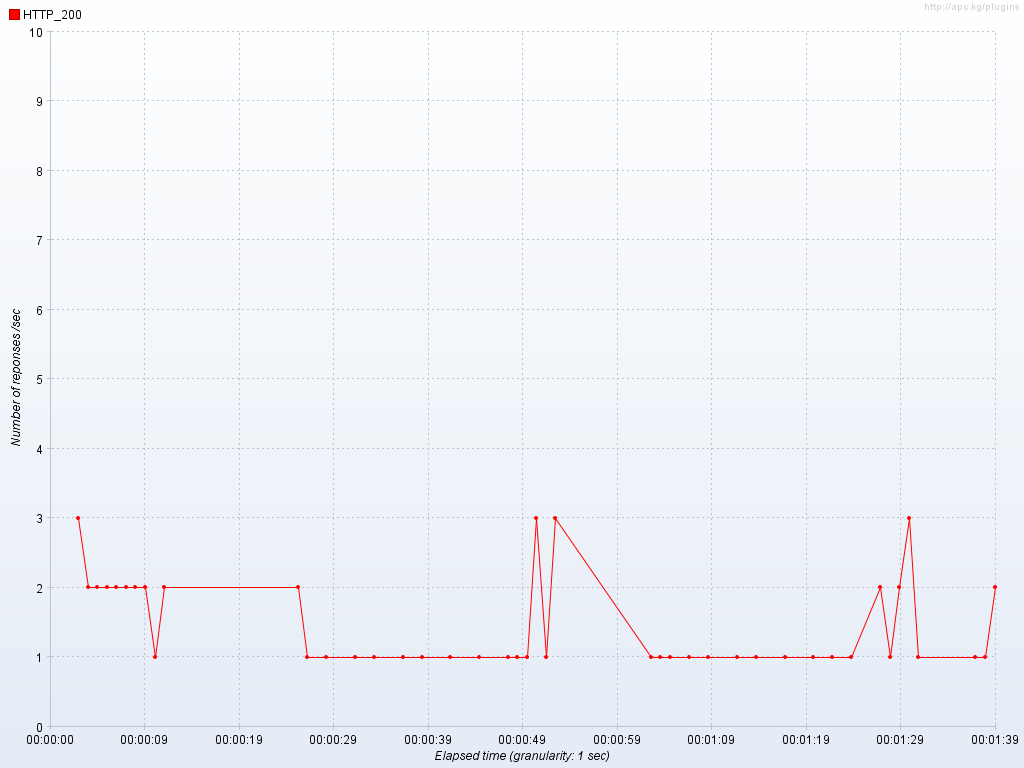
- ResponseCodesPerSecond
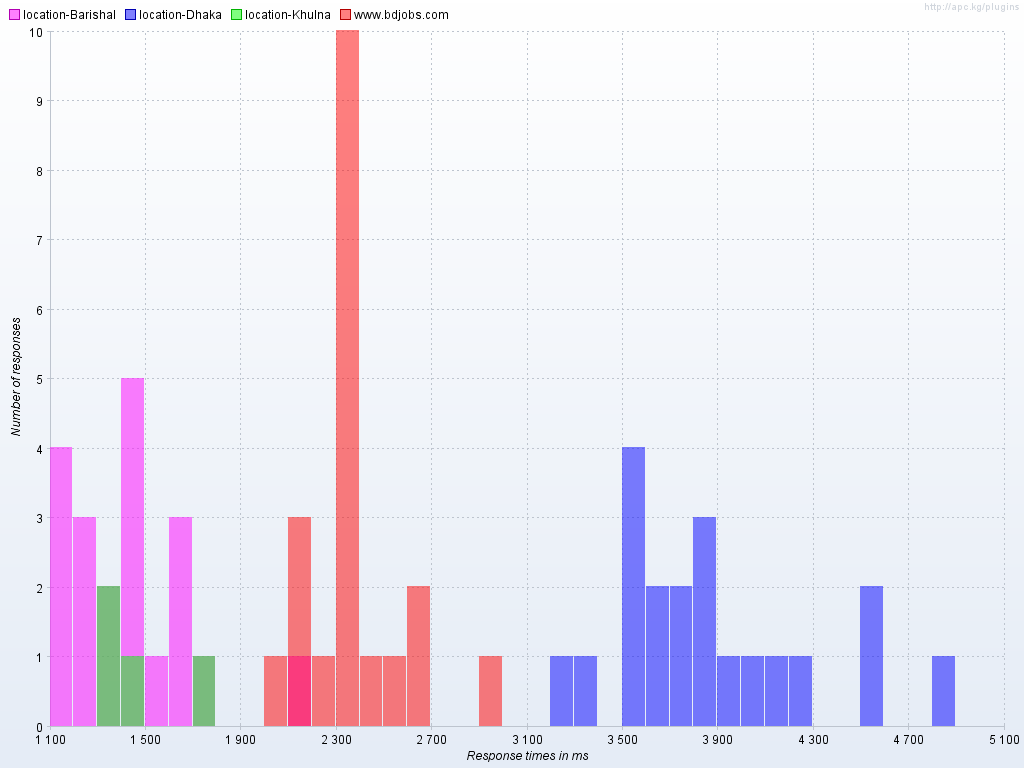
- ResponseTimesDistribution
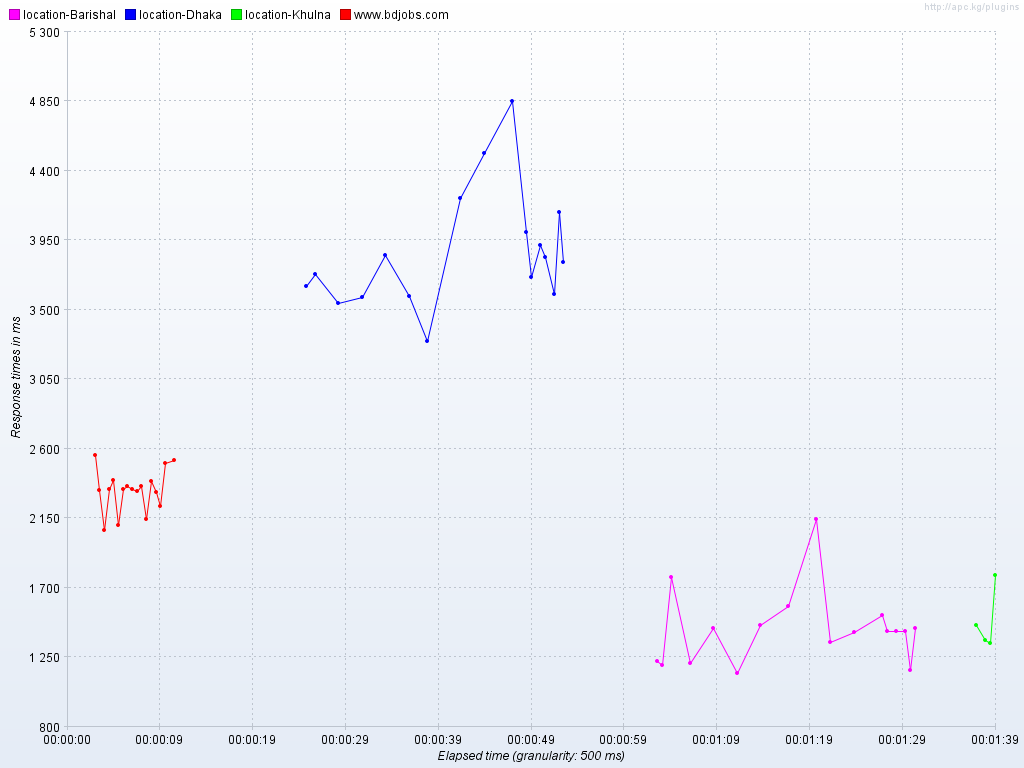
- ResponseTimesOverTime
- ResponseTimesPercentiles
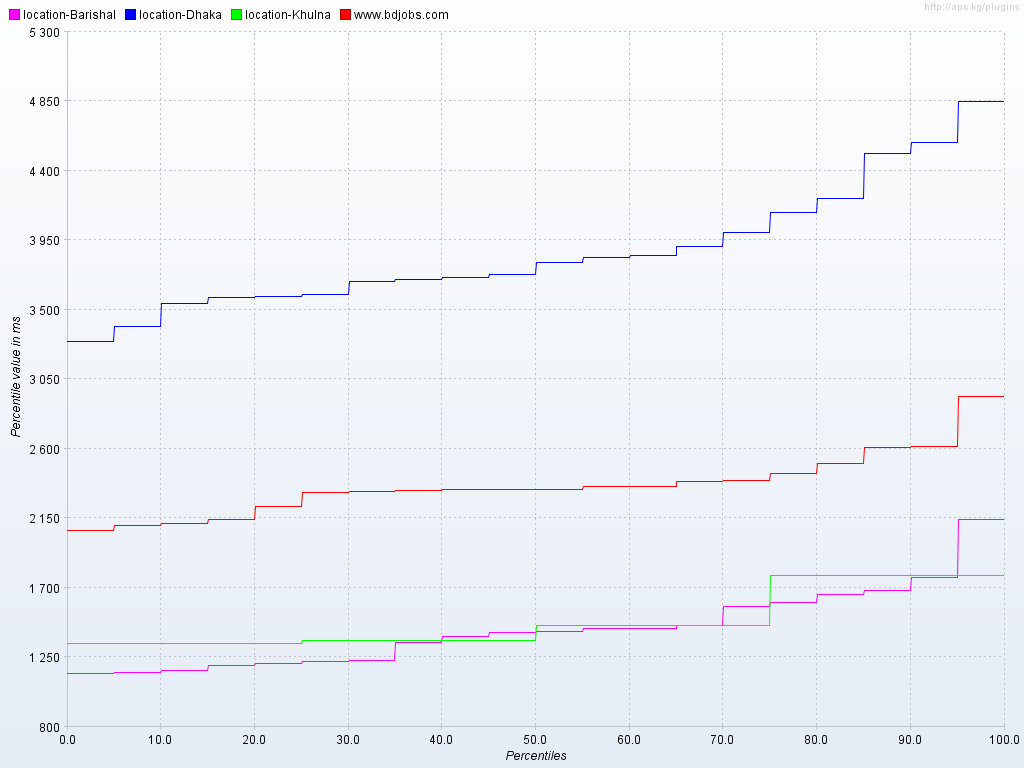
- ThreadsStateOverTime
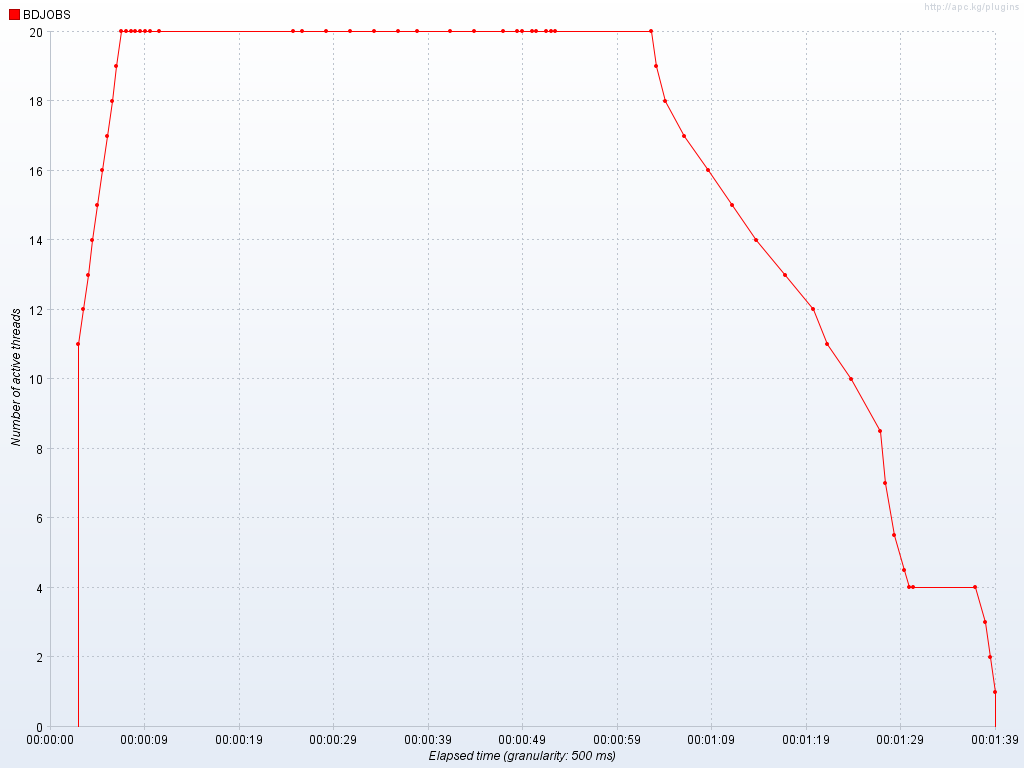
- ThroughputVsThreads
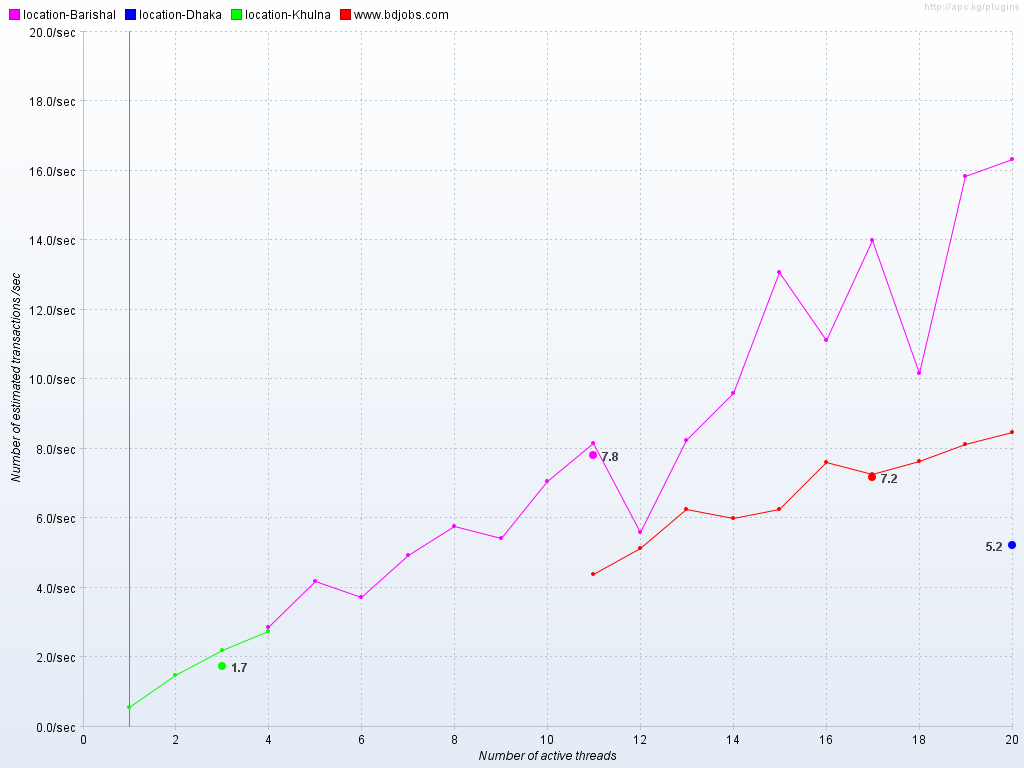
- TimesVsThreads
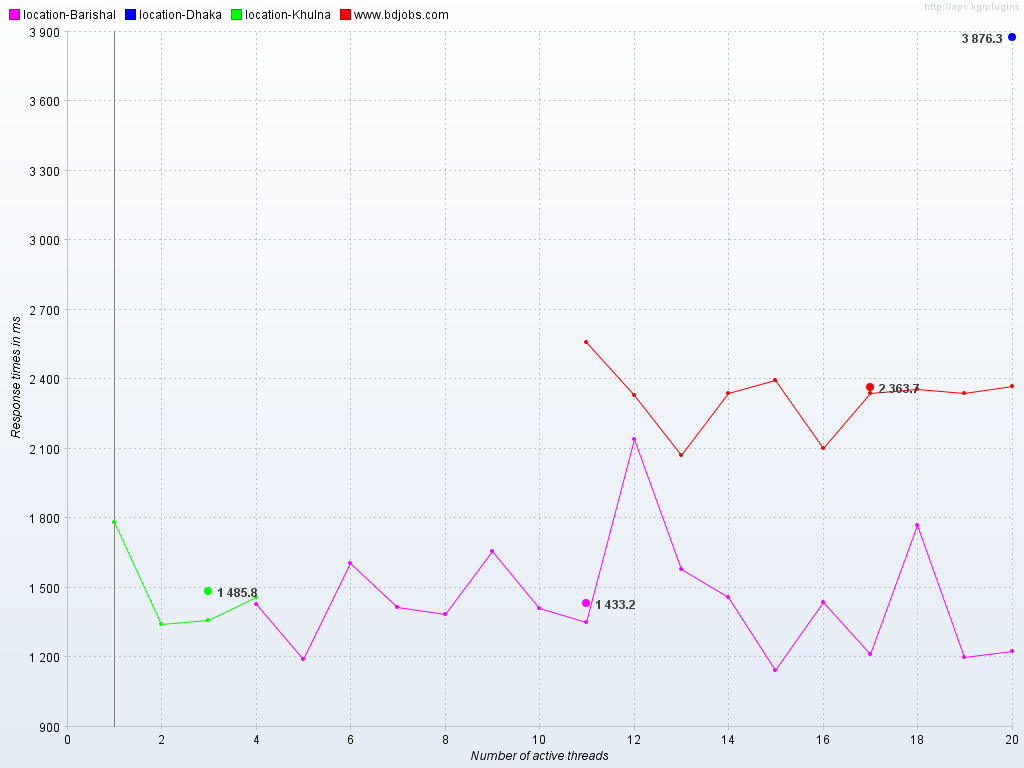
- TransactionsPerSecond
So, we have learned both modern HTML JMeter reporting and old style JMeter Graphs in two different project example.
Thanks :)