In this article we are going to see how we can configure JMeter (JVM) HEAP configuration during test. This is continuation post of this original article.
This is very important when you are testing for a big test in a big server or limited resources . As JMeter is JAVA application , so it runs on JVM.
Now, you might be thinking why we need to explicitly mention this.Because, unless we specify, JVM wont be initiated with this big size memory. And if your test case is complex or have many listeners, you probably need a big heap.
JVM Configurations
- To add JVM argument , under plugins configuration section
<jMeterProcessJVMSettings>will be present. Here are some examples. - to run JMeter JVM with 3.5gb* heap, and 768mb of metaSpace
<jMeterProcessJVMSettings>
    <xms>3584</xms>
    <xmx>3584</xmx>
    <arguments>
        <argument>-XX:MaxMetaspaceSize=768m</argument>
    </arguments>
</jMeterProcessJVMSettings>
- alternatively, you may apply as JVM Argument
<jMeterProcessJVMSettings>
    <arguments>
        <argument>-XX:MaxMetaspaceSize=768m</argument>
        <argument>-Xmx3584m</argument>
        <argument>-Xms3584m</argument>
    </arguments>
</jMeterProcessJVMSettings>
- to run enable profiling (for diagnosis) we need another two JVM arguments
-Xprof,-Xfuture. This is an optional step
<jMeterProcessJVMSettings>
	<xms>3072</xms>
	<xmx>3072</xmx>
	<arguments>
		<argument>-Xprof</argument>
		<argument>-Xfuture</argument>
		<argument>-XX:MaxMetaspaceSize=768m</argument>
	</arguments>
</jMeterProcessJVMSettings>
Now, you may ask why metaspace 768MB. In my example, I am using a lot of pre & post processing(string operations). I am adding this to prevent OOM during execution.
Following the same way, the 15gb Heap JVM, I am going to create for 1GB maximum metaspace.
Finally POM for 3.5GB HEAP
Finally POM for 15GB HEAP
<jMeterProcessJVMSettings>
    <xms>15360</xms>
    <xmx>15360</xmx>
    <arguments>
        <argument>-XX:MaxMetaspaceSize=1024m</argument>
    </arguments>
</jMeterProcessJVMSettings>
How to verify
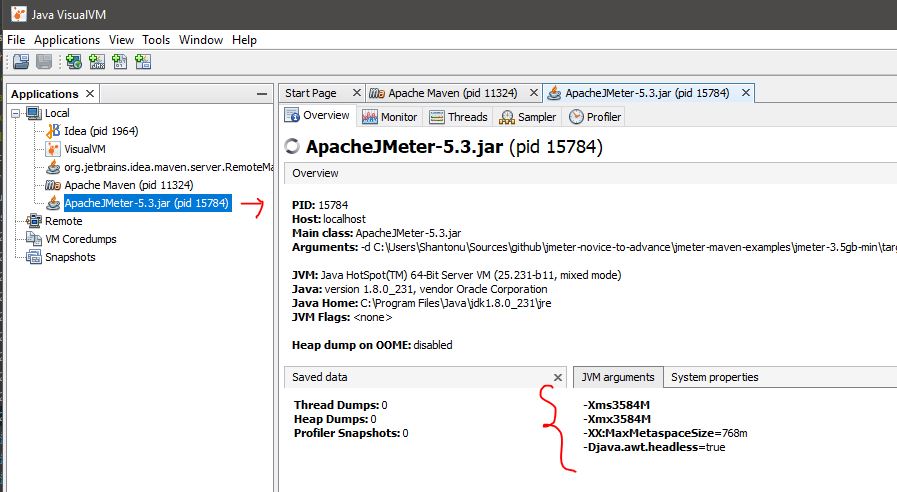
We are going to use jvisualVm to validate our configuration works. Here we will see two examples , one with 3.5gb Ram and another one with 15gb ram.
In Oracle JDK, you will see a tool come free called jvisualVM. Now a days, it comes with GraalVM. If you are not using oracle JVM/GraalVM, you can download jvisualvm from here
Now, lets run the test. When we run using maven
mvn clean verify
we can see this in jvisualVM
So, our configuration works.
Now, we will see the same thing for JMeter JVM with 15gb HEAP. This time, due to limitation of my PC’s RAM(16gb), i will run from commandline , not IDE. I will see some thing like this in jvisualvm
Notes:
- In all cases memory values are defined in megabyte
- Regular JVM argument can be added with
<argument>your_jvm_arguments</argument> - JMeter performs better with jdk9+
- Please avoid any listener in test case as runtime summary will be shown in commandline.
Project-source-3.5gb
Project-source-15GB
Thanks :)

