In this article we are going to see how can we measure a web page performance. As a part of SLA , when we need to measure performance for application , we need to know page performance. It will help to calculate Business SLA before finalizing project. This is actually continuing post for measuring performance for Business/Application SLA for a page. You may visit my previous post for know more background. In here I will measure only timing.
What is Browser Navigation Timing?
When a client( i.e browser) go to an URL , then there are certain request processing happens in background, like request goes to gateway,(local network) then go to DNS, then resolver, then resolve and goto to destination, each layer request and technological etc. I am avoiding detail as this post intend to know timing only. As this transformation is common for all web pages , w3c provide specification for each event. W3C also has specific definition & distribution for navigation timing.
Ref : navigation & publications.
Summary of the references:
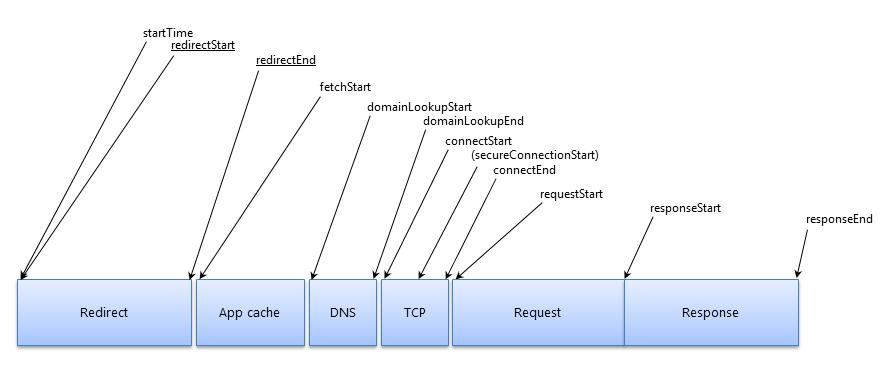
Page navigation performance timing consist of following items navigationStart , unloadEventStart , unloadEventEnd, redirectStart, redirectEnd, fetchStart, domainLookupStart, domainLookupEnd, connectStart , connectEnd , secureConnectionStart , requestStart, responseStart, responseEnd, domLoading, domInteractive, domContentLoadedEventStart,domContentLoadedEventEnd, domComplete, loadEventStart, loadEventEnd
And, each client (a browser) will get those via a common interface PerformanceTiming , which should be implemented by different browser to show those timing.
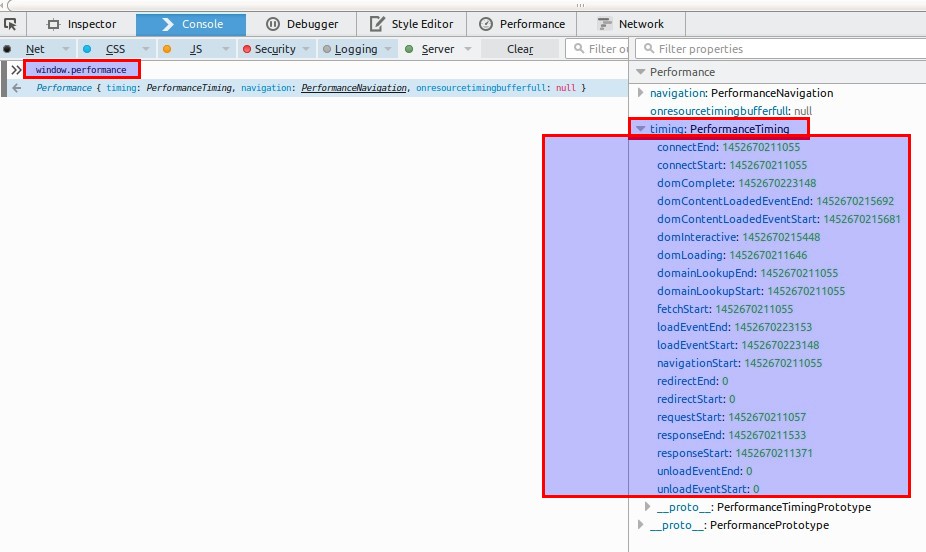
Most of modern browser implemented this. Here is the screen shot from IE11 & Chrome. (open browser tool and type window.performance in console, you can see following)
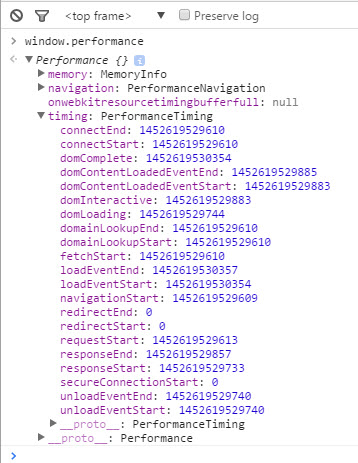
For detail understanding, you may visit google chrome dev. This is the gist.
For SLA, we may not need this broken time details, so we if we calculate Total primarily , it should be comprehensive. This detail info is helpful when we need to know breakdown analysis.
APDEX
There was a movement regarding Application Performance Index for applications among companies. This values refers to user satisfaction based on usages of the application. In short, Apdex refers to a value from 0-1 where higher value means full satisfaction. Simple formula
- Apdex = (Satisfied Count + Tolerating Count / 2) / Total Samples
Example : Let’s assume collecting 10 samples from an application where SLA was 5s.5 samples were below SLA(5s) , 3 samples are 5-8s, 2 samples are 8s+. So,
- Apdex = (5+3/2)/10 = 0.65
Note : Apdex can also be measured page wise, transaction etc wise specifically .
More detail you can find
Now, let’s see some method to measure these timing.
Measuring inside a browser :
Use Browser Tools :
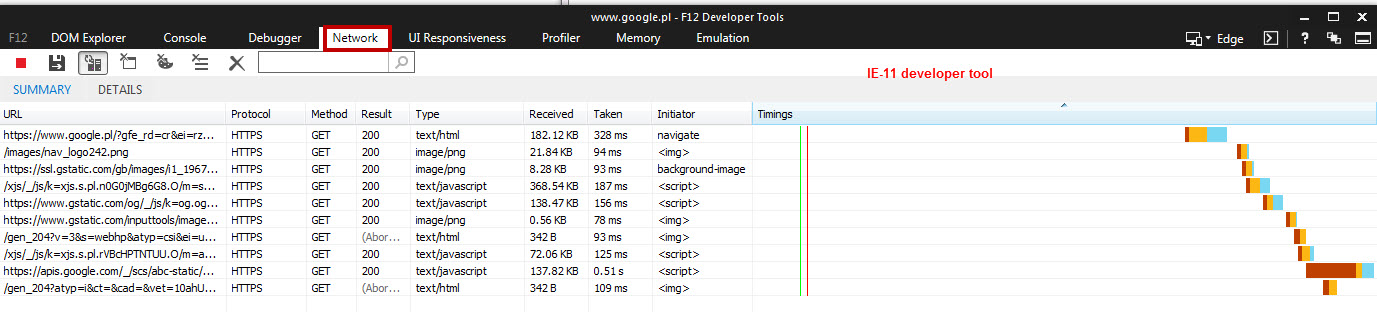
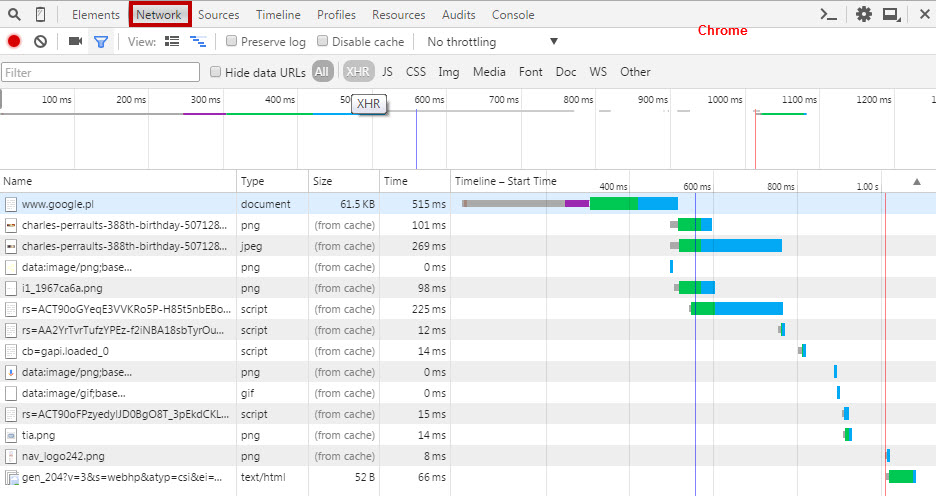
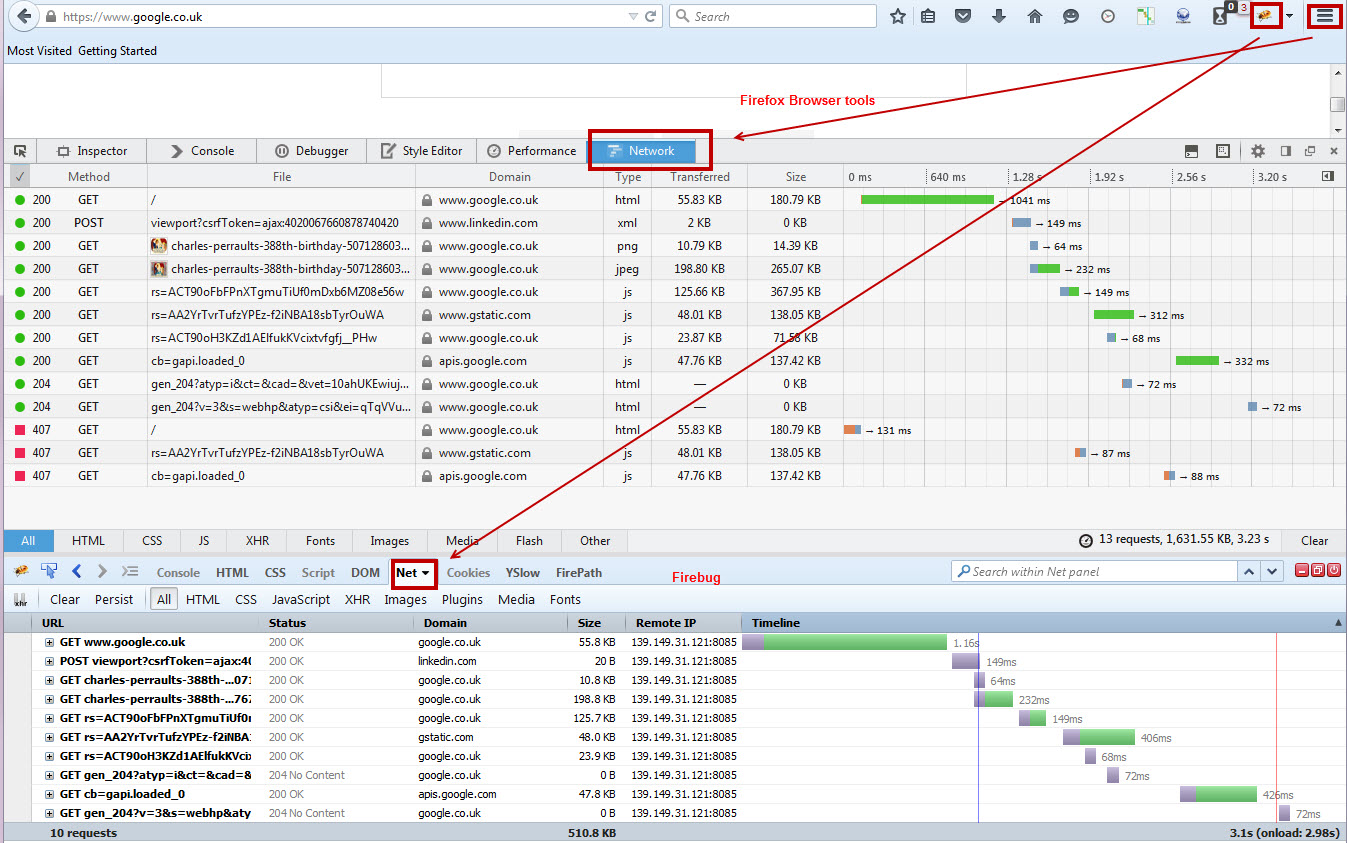
All major browser has this, like chrome, IE11 or Firefox, if you press F12 or select developer tools you can see developers tool. In there, if you click network tab, you can easily see each request with time distribution.
- Chrome :
- IE :
- Firefox : (browser tools + Firebug)
Use Browser Plugins/Addons :
To make life easier , many developer community made browser plugins to get these timing easily. That means, beside browser tools, we can get those time using plugins or addons.
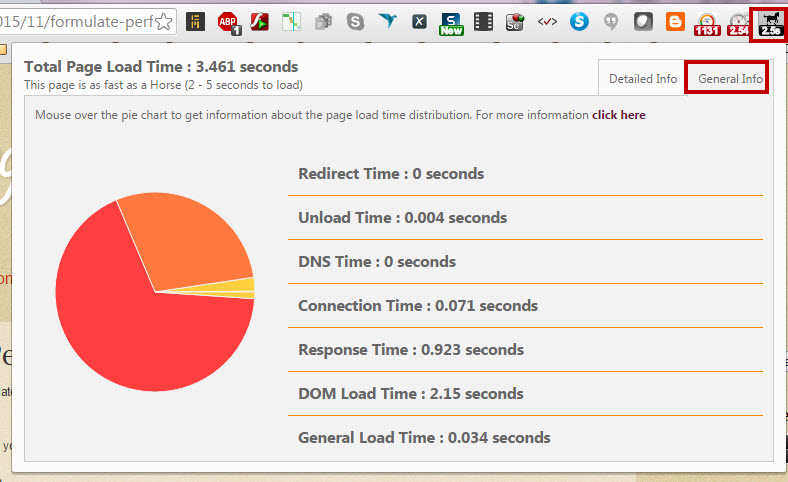
Performance Analyzer :
Addon available for Firefox & Chrome, single click all summary with charts.
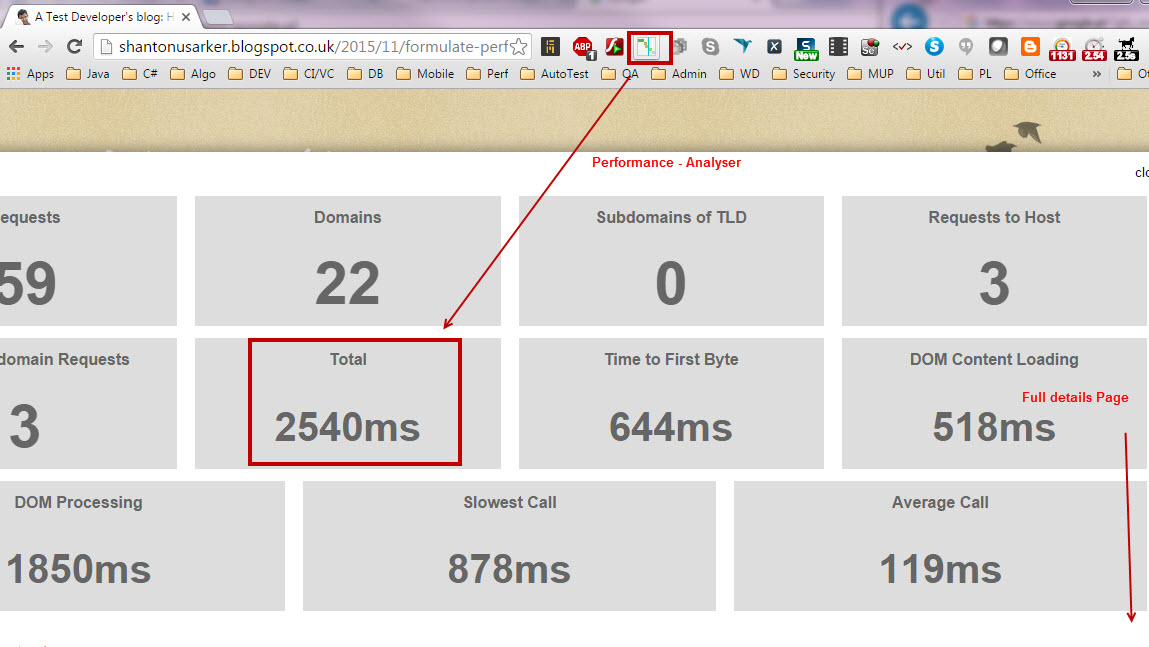
Detail report format is here.I prefer this due to summary view and very easy for QA, BA or any non technical personal to measure page timing very easily.
Some extra Chrome Addon does similar things :
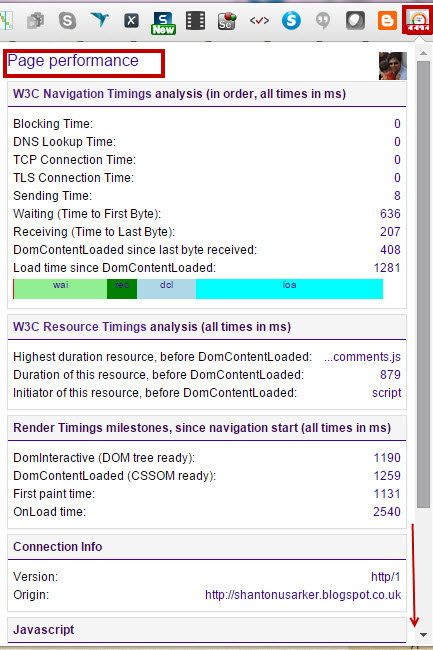
Page performance :
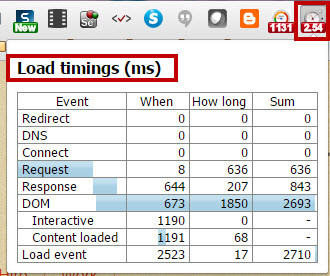
Page Load Time :
Analyze Page Performance :
By JavaScript in console:
We can run small javascript in browser console and get the navigation timing also(as I mention in basic part). From chrome/IE this is the command if you run window.performance. You will be able to see full timing. (here is image from firefox)
By JS framework :
It is very mature to have such capability of an web application to get timing inbuilt with application. There are lots of framework & libraries for that. One of them is Boomerang. It is simple a JS framework that you can use measure time. Again, like as other frameworks, it not only gives navigation timing, it can also give you detail of request processing timing which is very helpful to track down performance bottle knacks.
By JMeter-webdriver sampler
In JMeter, we can drive selenium driven test to run browser and measure time. This way we can get time whenever we want , spatially useful when running any performance test in parallel. You can get full details here
By a Proxy :
We can also use local proxy to measure the timing when the app is running in a browser. My favorite is fiddler (for windows)
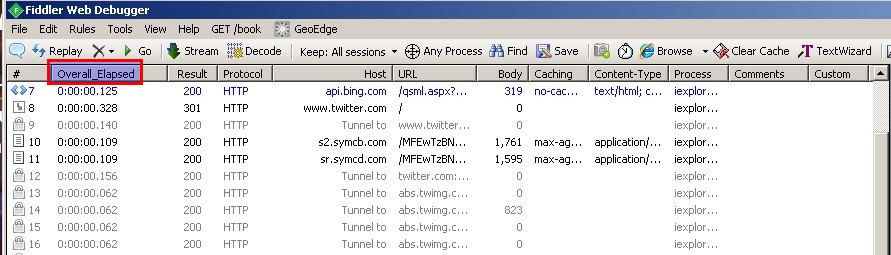
Fiddler :
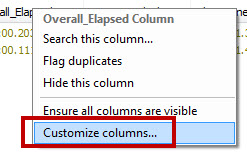
In fiddler , if we just add our necessary columns , we can monit or measure the timing. To do so,right click and click customize columns, and from collection select session timers, you will see full list of time collection from
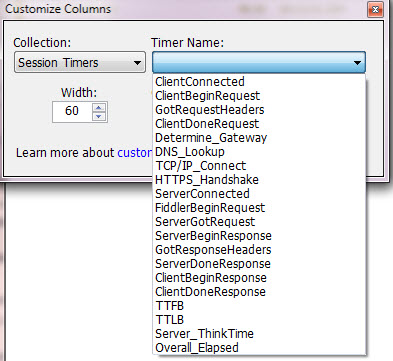
I like the overall Elapsed time. If I select that and then we can see traffic captured with total timing (very good to measure time quickly without breakdown all complexity)
By Selenium tests :
By Unit test execution time :
As we see, selenium is driven by unit test runner, it is always easy to add timing flags in unit tests to get the timing. The following ways are useful. Junit :
-
Manually : We can use manual timers , before test and after test to get the execution time. This consider as least useful as it takes lots of time to add code for each tests.
-
Junit TimeOut : We can use timeout parameter inside each test (this timeout in MS)
@Test(timeout=100) -
Junit @Rule : If you use Junit 4.12, then you can use stopwatch. Its simply done by making with @Rule. I am adding small experiential test class
public class TestForStopWatch {
     @Rule
     public Stopwatch stopwatch = new Stopwatch() {
         @Override
         protected void succeeded(long nanos, Description description) {
             print(description, "succeeded", nanos);
         }
         @Override
         protected void failed(long nanos, Throwable e, Description description) {
             print(description, "failed", nanos);
         }
         @Override
         protected void skipped(long nanos, AssumptionViolatedException e, Description description) {
             print(description, "skipped", nanos);
         }
         @Override
         protected void finished(long nanos, Description description) {
             print(description, "finished", nanos);
         }
     };
    @Test
    public void test() throws InterruptedException {
        long delta = 10;
        Thread.sleep(100L);
        assertEquals(100d, stopwatch.runtime(TimeUnit.MILLISECONDS), delta);
        Thread.sleep(900L);
        assertEquals(1000d, stopwatch.runtime(TimeUnit.MILLISECONDS), delta);
    }
     private static void print(Description description, String status, long nanos){
         System.out.println("Test -> "+     description.getMethodName()+" : Status "+ status+"Timeout : -> "+ TimeUnit.NANOSECONDS.toMicros(nanos));
     }
}
And in the output you can see test passed & printing in command line about tests.
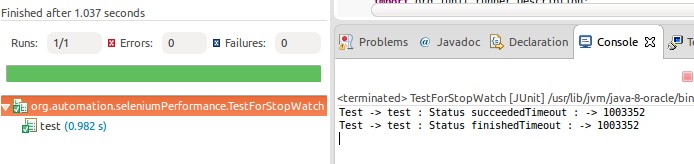
From test(), you can see I wait 100ms, then compare stopwatch time (which prints) and assert the time . Doing the same thing again. Firs validation 100ms wait, and then 1000ms wait(100+900).
- Junit Benchmark @Rule : This is small junit based benchmark library to run benchmark like full performance tests. Resource can be found here. This also use @Rule. And this is very simple like as stopwatch implementation. I am adding very small example.
public class JunitBenchmarkTests extends AbstractBenchmark{
    @After
    public void tearDown() throws Exception {
    }
    @Test
    public void test() throws InterruptedException {
        Thread.sleep(20);
    }
    @BenchmarkOptions(benchmarkRounds=10,warmupRounds=1, concurrency=3 )
    @Test
    public void testWithBenchMark() throws InterruptedException {
        Thread.sleep(20);
    }
}
please see the command line information regarding performance test exertion
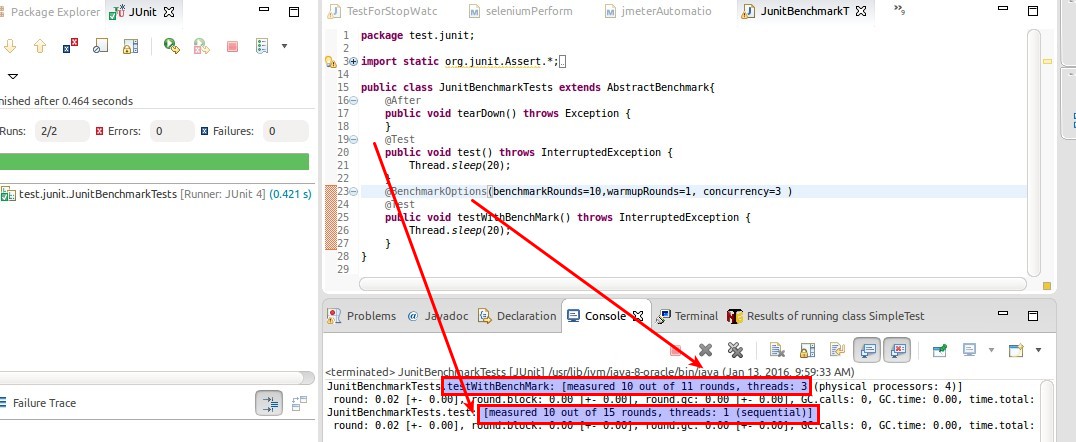
From here, we can see, like as regular performance test, we can include thread number, iteration inside tests and measure timing. Very useful when you are testing API level test. you may see this blog for more details
By running JavaScript in Selenium :
As we know, we can run JavaScript in selenium, so if we run navigation timing scripts in web driver, we can easily get the all type of timing. Here is one single helper class NevigationTimeHelper which takes a driver and get all timing.
public class NevigationTimeHelper {
    private WebDriver driver = null;
    Map<String, Object> timings = null;
    private final String JavaScriptForPerformance = "var performance = window.performance || window.webkitPerformance || window.mozPerformance || window.msPerformance || {};var timings = performance.timing || {};return timings;";
    public NevigationTimeHelper (WebDriver adriver){
        this.driver = adriver;
        getAllTiming();
    }
    private void getAllTiming(){
        JavascriptExecutor jsrunner = (JavascriptExecutor) driver;
        timings = (Map<String, Object>) jsrunner.executeScript(JavaScriptForPerformance);
    }
    private Long getAnTime(String name){
        return (Long)timings.get((Object)name);
    }
    public Long getnavigationStart(){
        return getAnTime("navigationStart");
    }
    public Long getunloadEventStart(){
        return getAnTime("unloadEventStart");
    }
    public Long getunloadEventEnd(){
        return getAnTime("unloadEventEnd");
    }
    public Long getredirectStart(){
        return getAnTime("redirectStart");
    }
    public Long getredirectEnd(){
        return getAnTime("redirectEnd");
    }
    public Long getfetchStart(){
        return getAnTime("fetchStart");
    }
    public Long getdomainLookupStart(){
        return getAnTime("domainLookupStart");
    }
    public Long getdomainLookupEnd(){
        return getAnTime("domainLookupEnd");
    }
    public Long getconnectStart(){
        return getAnTime("connectStart");
    }
    public Long getconnectEnd(){
        return getAnTime("connectEnd");
    }
    public Long getsecureConnectionStart(){
        return getAnTime("secureConnectionStart");
    }
    public Long getrequestStart(){
        return getAnTime("requestStart");
    }
    public Long getresponseStart(){
        return getAnTime("responseStart");
    }
    public Long getresponseEnd(){
        return getAnTime("responseEnd");
    }
    public Long getdomLoading(){
        return getAnTime("domLoading");
    }
    public Long getdomInteractive(){
        return getAnTime("domInteractive");
    }
    public Long getdomContentLoadedEventStart(){
        return getAnTime("domContentLoadedEventStart");
    }
    public Long getdomContentLoadedEventEnd(){
        return getAnTime("domContentLoadedEventEnd");
    }
    public Long getdomComplete(){
        return getAnTime("domComplete");    }
    public Long getloadEventStart(){
        return getAnTime("loadEventStart");
    }
    public Long getloadEventEnd(){
        return getAnTime("loadEventEnd");
    }
}
Here we see, as window.performance gives a MAP type collection, so we have collect all measurement and parse/select as we need. So, I put each type in separate function name to keep things simple.
I avoid other unit test platforms like Nunit , MS Unit, Xunit for dotnet to make things simple. Each unit test runner has its own implementation to measure time
Browser MOB proxy with selenium :
If we have existing selenium script, we can use BrowserMOB proxy to measure time. This is very simply done by keeping webdriver running under proxy and we can get every performance measurement including in page JS execution time(if that is called by you selenium tests). Even you can store navigation timing detail as HAR(http archived file) to analysis further detail after tests. I will add separate posts on how to use browserMOB.
There are also APM tool vendors who provide these monitoring ,i will provide separate blog on APMs for this topic.
Thanks :)