In this post I will provide how to reproduce out of memory error in Java . We will see how to reproduce and what we can see in monitoring tools. This is a continuing article of out of memory error/explanation.
I am using Oracle JVM 1.6 x64 & Oracle JVM 1.8 x64 on windows 7 x64/8gb ram/ 2.5Ghz Core i5 laptop.
Tools :
IDE :
- Eclipse
Profiling/Monitoring tool :
- Visual VM
- Jconsole (optional)
- Yourkit (optional)
Source
I use 2 classes, 1 for growing object and another one to run main method & print memory info. You can use single class for that.
public class HeapOOM
{
    public void oomByMem() throws Exception
    {
        int arraySize = 2, loop=1;
        TestOOM.showMemoryInfo();
        while(true){
            System.out.print("\nIteration " + loop++);
            TestOOM.showMemoryInfo();
            int[] fillupmemory = new int[arraySize];
            arraySize*=2;
            System.out.println("\nIteration Ends");
            Thread.sleep(3000);
        }
    }
}

public class TestOOM
{
    public static void main(String[] args) throws Exception
    {
        new HeapOOM().oomByMem();
    }
    public static void showMemoryInfo()
    {
        System.out.print("\nTotal memory : "+Runtime.getRuntime().totalMemory());
        System.out.print(" Free : "+Runtime.getRuntime().freeMemory());
        System.out.print(" Max : "+Runtime.getRuntime().maxMemory());
    }
}
- I am allocating integer array and after each loop
- I am doubling my allocation and running loop infinite to reach OOM.
- I am providing thread sleep so that I can get chance to attach profiler.
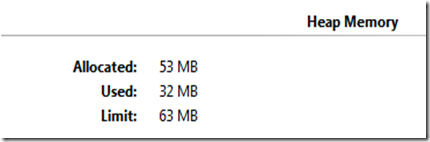
Monitoring in yourkit
- From summary page the limit shown
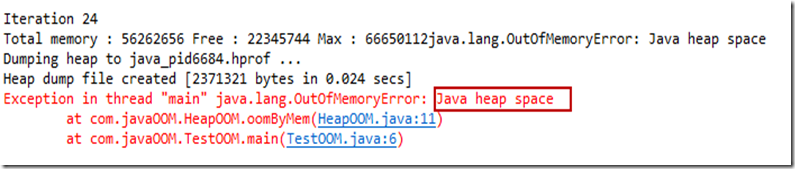
- At iteration 24 ,I got error shown in eclipse console.
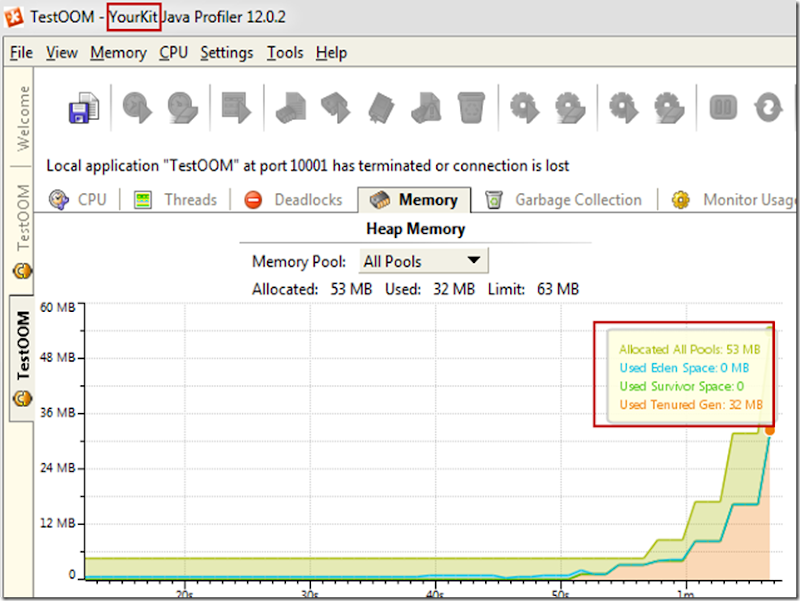
- When I profile via your kit, this was the state.
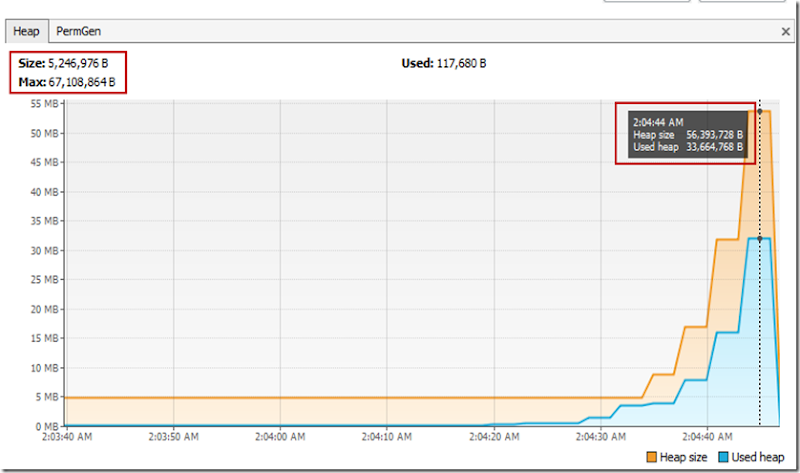
Monitoring in Visual VM
Why this error is happening?
As I was increasing memory allocation doubling each iteration, at the end point , JVM can’t allocate more than default sizing.
If you increase heap size from default using –Xmx<size> (I used –Xmx2048m), it will grow more iteration means OOM will be occurring more later on.
Now, you can do some experiment, you can decrease the growth by, not multiplying, by adding 10/50 increment. This will not increase resource allocation in radical way, so garbage collector will get time to collection and you will get long time to create OOM.
Again, if you allocate large number of memory at a time, if it is more than eden space , then you may see OOM also, so better to keep some ration better eden space & old generation(Tenured space).
Thanks.. :)